
Commodities | Oct 01 2026

Seasonality and other factors support a higher price of gold in the weeks ahead, DeCarleyTrading.com's Carley Garner reports.
By Carley Garner, DeCarleyTrading.com
We’ve been bearish on gold for quite some time and remain bearish overall. But the stars are aligning for what has generally been a high-probability setup for a relief rally, and we cannot ignore it.
For starters, according to our friends at MRCI (a seasonal trading service), going long December gold on or about September 29 and holding through October 25 has been profitable in 12 of the last 15 years.
Obviously, this is a tendency, not a guarantee, but the Indian festival and wedding season, combined with China’s Golden Week celebration, tends to boost the metal.
More compelling, however, is the idea that lower oil prices should allow Treasuries to come off lows (interest rates off highs).
If we are right about this assumption, gold “should” see buyers more willing to step in.
Higher interest rates make holding non-interest-bearing assets such as gold less attractive. We aren’t just making this up; the data confirms it.
Over the last 30 trading sessions, gold and the 10-year note have been settling in the same direction 88% of the time.
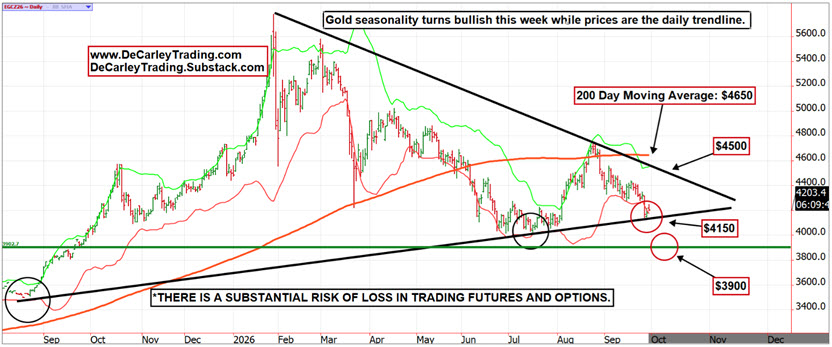
Lastly, we’re testing the uptrend line on a daily chart as October futures head into delivery. We often see contracts spiking in the direction of the trend as they contend with first notice day (the day futures traders must be out of long positions to avoid the cash market delivery process) but then reverse after the dust settles.
October gold futures aren’t necessarily a liquid trading month; in fact, they’re illiquid. It is an expiration month added years after 100-ounce gold futures existed, and speculators never adopted it as mainstream.
Instead, most of them skip from August gold to December gold. Nevertheless, gold futures collapsed -US$170 in a single session going into first notice day and still held support.
The immediate outlook for gold looks bullish
If the trendline holds as expected, gold should move into the US$4500 to US$4650 area. This represents the downtrend resistance line and the 200-day moving average.
Given our long-term outlook for failed rallies, we wouldn’t expect prices to meaningfully exceed US$4650 or sustain those levels.
Nevertheless, if you disagree with our bearish bias and want to be long gold or simply agree that a relief rally is likely, this appears to be a high-probability set-up.
Of course, even odds in your favor don’t guarantee success.
DeCarley Trading (a division of Zaner)
Twitter:@carleygarner
info@decarleytrading.com
Re-published with permission. Views expressed are not by association FNArena’s.
Technical limitations
If you are reading this story through a third party distribution channel and you cannot see the chart included, we apologise, but technical limitations are to blame.
Find out why FNArena subscribers like the service so much: “Your Feedback (Thank You)” – Warning this story contains unashamedly positive feedback on the service provided.
FNArena is proud about its track record and past achievements: Ten Years On