
Technicals | Sep 10 2026

This story features COMMONWEALTH BANK OF AUSTRALIA.
For more info SHARE ANALYSIS: CBA
The company is included in ASX20, ASX50, ASX100, ASX200, ASX300 and ALL-ORDS
The Chartist reports the technical picture for CBA shares remains supportive in sharp contrast to the bearish voices that continue calling those shares heavily overvalued.
By The Chartist
Technical view on Commonwealth Bank ((CBA)) · 8 September 2026 · Peter Hammersley
Reasons to be optimistic:
- The banks have been underperforming the broader market recently.
- A lot of the above could be put down to sector rotation.
- FY26 results highlighted better margin trends compared with its peers.
- Management has indicated it has flexibility to manage costs and pre-provision profits.
- A symmetrical triangle could be locked in.
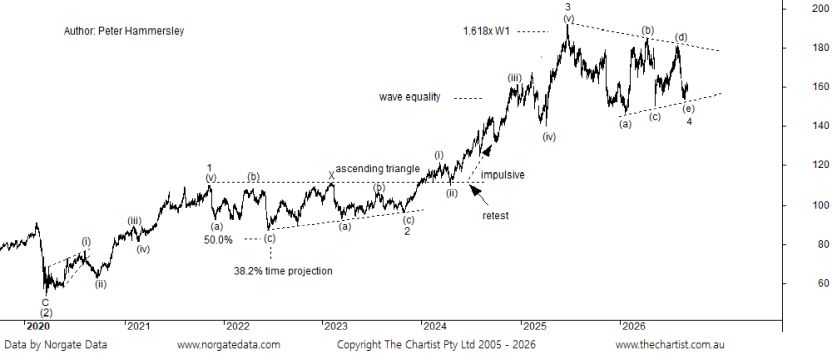
I’m going to stick to the daily chart of CBA this evening, but I have squashed the price action up to incorporate the larger degree patterns.
Before we get to those, it’s worth mentioning the stance being taken by brokers. Out of the 5 we follow that have covered the company since the beginning of August, not one is bullish.
That doesn’t come as a surprise. For an eternity, they have been bearish on most of the banks, but especially CBA.
Most suggest it’s substantially overvalued, and has been for many years. It may well be trading at a premium, but there’s probably a reason for that.
It’s a strong, well-managed company, so it could be argued that it deserves its premium status. Either way, those 5 brokers clearly disagree.
I’m not going to comment on the fundamental picture, but from a technical one, there’s no reason to be anything other than bullish.
Let’s refresh our memories from the March 2020 lows. A leading diagonal triangle got the trend underway, resulting in a 5-wave move up to wave-1.
The correction that followed wasn’t textbook, as it unfolded as a complex combination pattern. It also incorporated an ascending triangle.
If we fast-forward, we can see that wave-3 extended by heading up to the 1.618 projection, as shown.
Without wanting to repeat myself, it’s uncanny how many times a third leg completes at that key Fibonacci ratio.
Wave-4 has been forming as a symmetrical triangle, which also meets the requirements to be called the Elliott variety.
It contains the required 5-internal swings labelled-(a) through-(e). It is early days, but I’ve also labelled the recent pivot low as completing the whole corrective pattern into wave-4.
If correct, impulsive price action should return, with wave-5 taking price above what’s shown on this chart. Let’s not forget, it’s also going to be within a larger degree wave-(3). In other words, the trend could last for several years.
My only slight reservation is that the guideline of alternation hasn’t been adhered to. This states that the two corrective patterns should be completely different in nature.
As can be seen, we have triangles completing both of those corrections. It is unusual, although no rules have been broken.
As stated, it’s a guideline only, so it doesn’t invalidate the patterns. Either way, a push above the upper boundary of the triangle in a move that sticks would validate our wave count.
There is a bit of work to do before getting up toward the $180.00 region, so patience is going to be required.
Trading strategy
If the breakout transpires, it’s not going to happen overnight or even over the coming days. As such, I’m not going to make a formal recommendation this evening.
Should impulsive price action take price to the upper trend line of the triangle, I’ll take another look, as it would be a bullish proposition.
If you are keen, I would wait until the upper boundary is overcome before initiating long positions.
The protective stop will need to be placed beneath the prior pivot low, which may yet need to be made.
We have CBA on our short-term watchlist.
Re-published with permission of the publisher. www.thechartist.com.au All copyright remains with the publisher. The above views expressed are not by association FNArena’s (see our disclaimer).
This report may contain advice that has been prepared by The Chartist Pty Ltd (ABN 40 641 323 051). The Chartist Pty Ltd is a Corporate Authorised Representative (CAR No. 1282007) of Shartru Wealth Management Pty Ltd ABN 46 158 536 871, AFSL 422409. Any advice is considered general advice and has been prepared without taking into account your objectives, financial situation or needs. Because of that, before acting on this advice you should therefore consider the appropriateness of the advice having regard to your situation and your own objectives, financial situation and needs. We recommend you obtain financial, legal and taxation advice before making any financial investment decision. If the advice relates to the acquisition, or possible acquisition, of a product (other than a security e.g. a CFD) then the client should obtain the relevant Product Disclosure Document and consider it before making any decision about whether to acquire the product. Past performance is not a reliable indication of future performance. This material has been prepared based on information believed to be accurate at the time of publication. Subsequent changes in circumstances may occur at any time and may impact the accuracy of the information.
Risk Disclosure Statement
THE RISK OF LOSS IN TRADING SECURITIES AND LEVERAGED INSTRUMENTS I.E. DERIVATIVES, SUCH AS FUTURES, OPTIONS AND CONTRACTS FOR DIFFERENCE CAN BE SUBSTANTIAL. YOU SHOULD THEREFORE CAREFULLY CONSIDER YOUR OBJECTIVES, FINANCIAL SITUATION, NEEDS AND ANY OTHER RELEVANT PERSONAL CIRCUMSTANCES TO DETERMINE WHETHER SUCH TRADING IS SUITABLE FOR YOU. THE HIGH DEGREE OF LEVERAGE THAT IS OFTEN OBTAINABLE IN FUTURES, OPTIONS AND CONTRACTS FOR DIFFERENCE TRADING CAN WORK AGAINST YOU AS WELL AS FOR YOU. THE USE OF LEVERAGE CAN LEAD TO LARGE LOSSES AS WELL AS GAINS. THIS BRIEF STATEMENT CANNOT DISCLOSE ALL OF THE RISKS AND OTHER SIGNIFICANT ASPECTS OF SECURITIES AND DERIVATIVES MARKETS. THEREFORE, YOU SHOULD CONSULT YOUR FINANCIAL ADVISOR OR ACCOUNTANT TO DETERMINE WHETHER TRADING IN SECURITIES AND DERIVATIVES PRODUCTS IS APPROPRIATE FOR YOU IN LIGHT OF YOUR FINANCIAL CIRCUMSTANCES.
Technical limitations If you are reading this story through a third party distribution channel and you cannot see the chart included, we apologise, but technical limitations are to blame.
Find out why FNArena subscribers like the service so much: “Your Feedback (Thank You)” – Warning this story contains unashamedly positive feedback on the service provided.
FNArena is proud about its track record and past achievements: Ten Years On
Click to view our Glossary of Financial Terms
CHARTS
For more info SHARE ANALYSIS: CBA - COMMONWEALTH BANK OF AUSTRALIA
