
Technicals | 11:18 AM

This story features AMP LIMITED.
For more info SHARE ANALYSIS: AMP
The company is included in ASX100, ASX200, ASX300 and ALL-ORDS
The Chartist reports AMP's successful breakout zone retest around the $2.00-$1.95 zone may still be required to prove that this bullish move north is the real deal.
By The Chartist
Technical discussion
Reasons to be bullish:
- Management still appears to be stabilising the underlying business.
- Their $150.00 million share buyback is now at the halfway point
- Partnerships in China more than doubled their contribution in the first half.
- Impulsive price action has been strong yet price now looks to be in breather mode
AMP’s ((AMP)) updated analyst narrative now centres on a higher assessed fair value, which has shifted from $2.35 to $2.45.
The company released its third-quarter cashflows and business update on October 15, 2026, highlighting growth in its wealth platforms alongside narrower superannuation outflows and a shrinking mortgage book.
Total residential mortgages declined by $400 million to $23.2 billion (down from $23.6 billion in Q2 26) yet it needs to be noted that this is part of AMP’s deliberate strategy to reduce capital intensity in banking.
AMP also confirmed it has successfully completed $75 million of its active $150 million on-market share buyback program, hitting the exact halfway milestone. Clearly stability and investor confidence has started to return for AMP which has also been reflected on the price chart.
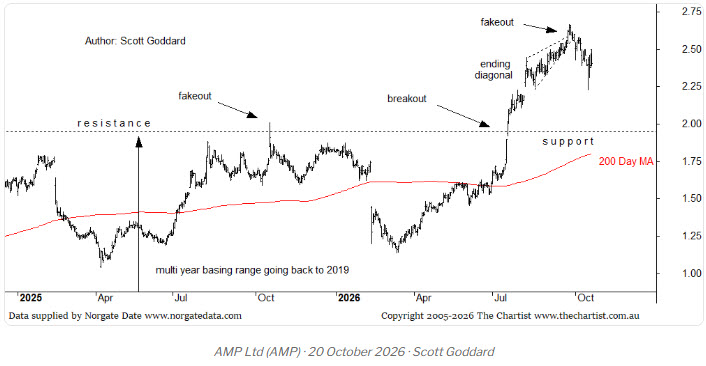
There is no doubting that AMP price action has finally woken up from its hibernation period that stemmed all the way back to 2019.
The breakout move above the $1.95 zone was performed with immense conviction back in July this, and to this point in time there has been no retesting of this old strong resistance line.
The breakout move was also accompanied by above average buyer volume that continued right up until the $2.45 high was tagged. This was pre price action reverting itself into a more laboured ending diagonal which signalled that the solid run north was starting to wane.
Rising wedge patterns or what are commonly called ending diagonals are bearish patterns and even though the one on the AMP chart faked out to the upside for a couple of sessions tagging a high of $2.67, it did eventually trigger the pattern with sellers taking over.
Thus far price has a tagged a low of $2.23 which is a full retracement of the ending diagonal pattern which is more than typical, with buyers coming back in quickly post this intraday low being tagged.
Whether these same buyers stick around throughout this retracement process remains to be seen, yet for now we remain open that a retesting or the original breakout zone for strength circa the $1,95 zone is still possible from here.
Simply put though, if this old longer term resistance zone circa can continue to hold strong from here, then further upside for AMP certainly looks possible looking well ahead.
Trading strategy
Now that the initial bull run north has completed with price back in breather mode, the stock is on our radar to see if a low risk pattern can form from here as part of this immediate pullback.
If it does then we will certainly review AMP again and be offering up a recommendation on the long side. We’ve added it to our watchlist to keep a close eye on.
Re-published with permission of the publisher. www.thechartist.com.au All copyright remains with the publisher. The above views expressed are not by association FNArena’s (see our disclaimer).
This report may contain advice that has been prepared by The Chartist Pty Ltd (ABN 40 641 323 051). The Chartist Pty Ltd is a Corporate Authorised Representative (CAR No. 1282007) of Shartru Wealth Management Pty Ltd ABN 46 158 536 871, AFSL 422409. Any advice is considered general advice and has been prepared without taking into account your objectives, financial situation or needs. Because of that, before acting on this advice you should therefore consider the appropriateness of the advice having regard to your situation and your own objectives, financial situation and needs. We recommend you obtain financial, legal and taxation advice before making any financial investment decision. If the advice relates to the acquisition, or possible acquisition, of a product (other than a security e.g. a CFD) then the client should obtain the relevant Product Disclosure Document and consider it before making any decision about whether to acquire the product. Past performance is not a reliable indication of future performance. This material has been prepared based on information believed to be accurate at the time of publication. Subsequent changes in circumstances may occur at any time and may impact the accuracy of the information.
Risk Disclosure Statement
THE RISK OF LOSS IN TRADING SECURITIES AND LEVERAGED INSTRUMENTS I.E. DERIVATIVES, SUCH AS FUTURES, OPTIONS AND CONTRACTS FOR DIFFERENCE CAN BE SUBSTANTIAL. YOU SHOULD THEREFORE CAREFULLY CONSIDER YOUR OBJECTIVES, FINANCIAL SITUATION, NEEDS AND ANY OTHER RELEVANT PERSONAL CIRCUMSTANCES TO DETERMINE WHETHER SUCH TRADING IS SUITABLE FOR YOU. THE HIGH DEGREE OF LEVERAGE THAT IS OFTEN OBTAINABLE IN FUTURES, OPTIONS AND CONTRACTS FOR DIFFERENCE TRADING CAN WORK AGAINST YOU AS WELL AS FOR YOU. THE USE OF LEVERAGE CAN LEAD TO LARGE LOSSES AS WELL AS GAINS. THIS BRIEF STATEMENT CANNOT DISCLOSE ALL OF THE RISKS AND OTHER SIGNIFICANT ASPECTS OF SECURITIES AND DERIVATIVES MARKETS. THEREFORE, YOU SHOULD CONSULT YOUR FINANCIAL ADVISOR OR ACCOUNTANT TO DETERMINE WHETHER TRADING IN SECURITIES AND DERIVATIVES PRODUCTS IS APPROPRIATE FOR YOU IN LIGHT OF YOUR FINANCIAL CIRCUMSTANCES.
Technical limitations If you are reading this story through a third party distribution channel and you cannot see charts included, we apologise, but technical limitations are to blame.
Find out why FNArena subscribers like the service so much: “Your Feedback (Thank You)” – Warning this story contains unashamedly positive feedback on the service provided.
FNArena is proud about its track record and past achievements: Ten Years On
Click to view our Glossary of Financial Terms
CHARTS
For more info SHARE ANALYSIS: AMP - AMP LIMITED
