
Commodities | May 27 2026

This story features IGO LIMITED, and other companies.
For more info SHARE ANALYSIS: IGO
The company is included in ASX100, ASX200, ASX300 and ALL-ORDS
A glance through the latest expert views and predictions about commodities. Expected growth in EV demand; impact on lithium prices; aluminium supply shock.
- Global EV sales projected to more than double by 2035
- Might this time be different for lithium?
- Largest supply shock in at least 50 years for aluminium
By Greg Peel
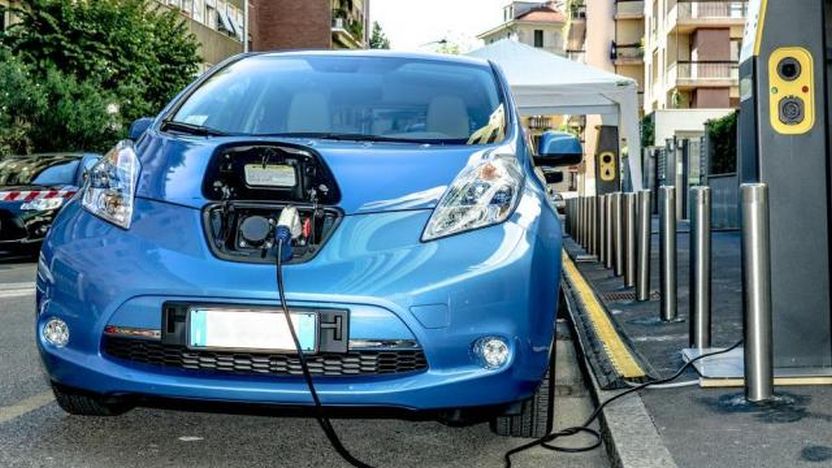
Electric Vehicles
Global electric vehicle (EV) sales grew strongly in 2025, Macquarie notes, increasing by more than 20% year on year. Growth was broad-based outside the US and, for the first time since 2022, was strongest in battery EVs rather than plug-in hybrids.
However, sales growth appeared likely to slow in 2026 amid policy changes in the US and China.
This has proven to be the case, with global EV sales flat in the first four months of 2026 relative to the same period in 2025, yet the headline figure masks significant regional divergence, with weakness in the US and China and strength elsewhere, Macquarie notes.
EV sales fell -33% in the US over the first four months of 2026. Trump’s EV policy rolled back federal incentives, tax credits, and infrastructure (chargers) funding, significantly slowing EV adoption and affecting automakers’ strategies.
EV sales fell -17% in China over the same period. The expiration of tax exemptions and subsidies are partly to blame, but cooling domestic demand can also be attributed to a weaker Chinese consumer, and rising input costs making EVs more expensive.
By contrast, sales rose by 26% in Europe and by 77% in the rest of the world over the same period.
Overall weakness was more pronounced earlier in the year, with EV sales bouncing in recent months alongside higher oil prices amidst the largest oil supply disruption in history.
In seasonally adjusted terms, EV sales rose by 9% between February and April, with gains broad-based across major regions.
We think of EVs as cars, but Macquarie reports EVs’ share of total light vehicle sales is at or near historical highs in most regions outside the US. Globally, EVs currently account for some 27% of all light vehicle sales, with that share closer to 60% in China.
UBS believes the current energy shock has shifted the balance for EVs and we are starting to see both anecdotal and quantitative evidence showing an upward shift in EV preferences.
EV sales are up 34%/40%/22% year on year, year to date, in March in Germany, France and the UK respectively though UBS notes sales in the US remain challenged.
At some 60% of global EV sales, Chinese EV demand remains key, and year to date performance is soft, UBS notes, down -18% year on year in March, reflecting reduced incentives and consumers waiting for new models.
But Chinese EV sales tend to be back-end weighted and UBS remains positive on a second half rebound. Prior to the Middle East conflict, UBS had assumed a two-year compound annual growth rate (CAGR) of 12%.
Looking further ahead, Macquarie reports the International Energy Agency has projected that EV sales would grow by around 10% this year.
More fundamentally, improving cost competitiveness, alongside tighter emissions and fuel economy standards, is expected to support robust EV sales growth over the next decade.
The IEA’s current scenarios suggest global EV sales will more than double by 2035 (9%-10% CAGR), reaching around half of global car sales. If realised, this would lift the global EV fleet to over 450m by 2035 from around 75m today, representing more than one-quarter of all light vehicles in use.
The IEA estimates indicate EVs are currently displacing around -1.7m barrels per day of oil demand, rising to 910mbpd under its forecast scenarios.
Lithium
EV demand clearly plays into lithium demand. Lithium demand is also impacted by demand for Battery Energy Storage Systems (BESS).
UBS’ analysis suggests cost deflation is driving a sharp inflection point for energy storage.
The impact of geopolitical shocks, oil/gas price spikes and AI-driven surging data centre power requirements combine with a forecast -30% decline in BESS system cost, which results in higher global BESS demand (up 6% to 1.6 TWh by 2030) with larger upgrades to the US and Rest of World.
UBS has upgraded its lithium price view reflecting
(1) an increasingly positive BESS view,
(2) increased EV demand penetration due to the Middle East conflict, positively impacting EV versus ICE (internal combustion engine) total cost of ownership economics, and (3) accelerating e-Truck demand in China.
UBS has also updated supply forecasts, trimming this year on IGO Ltd’s ((IGO)) output guidance downgrade for Greenbushes (WA), but adding to the outer years in anticipation of a supply response to higher prices.
New, unknown brown/greenfield projects will increasingly be needed to meet projected deficits by 2030 and beyond. As a result, UBS increases its spodumene price forecasts by up to 23% nearer term, and 17% long term, reflecting inflation in capital and operating costs in key producing regions.
The key supply question is not if but when supply can catch up. UBS has learned from previous cycles new supply can ramp relatively quickly.
But what has UBS incrementally more positive this time around is
(a) demand growth is larger in absolute terms, and
(b) new supply is more challenged, given increased policy/geological/commercial hurdles.
From the first post-EV lithium cycle, in which demand was satisfied by Chilean brines and Greenbushes, last cycle we saw new supply emerge from China (eg lepidolites) and Africa.
Going forward, UBS models supply growth of circa 596kt from 2025-2027, versus 623kt demand.
Australia (circa 23% of supply growth) sees growth from Liontown Resources’ ((LTR)) Kathleen Valley, PLS Ltd’s ((PLS)) Pilgangoora and IGO’s Greenbushes (albeit recently trimmed).
China (circa 28% of supply growth) includes a large addition at Qinghai Salt Lake and restart of CATL’s Jianxiawo mine (44% of China supply from mid-2026).
In Africa, UBS is tracking growth in Mali and Zimbabwe.
UBS is watchful of supply surprising to the upside, especially from less opaque regions (eg Nigeria). But at the same time, the analysts see listed producers seeking confidence before committing to lift production (restarts or new) amidst heightened macro uncertainty, diesel and other input disruptions and elevated lithium price volatility.
In UBS’ opinion, these factors temper the likely pace of much of the potential supply response.
UBS has upgraded prices as much as 47% across spodumene, lithium carbonate and hydroxide reflecting an incrementally tighter forecast for the market.
The analysts also upgrade their long term spodumene price 17% to US$1,400/t highlighting the continued inflationary environment in relevant mining jurisdictions (Canada, Australia), though highlight considerable uncertainty longer term on who solves structural deficits beyond 2030.
UBS remains overweight the sector with preference for IGO, Liontown and Mineral Resources ((MIN)), while PMET Resources ((PMT)) remains a compelling option into the long-term thematic.
Aluminium
The conflict in the Middle East is resulting in the largest aluminium supply shock in at least 50 years, Citi notes. Beforehand, supply cuts were being driven by oversupply and weak prices.
The world is likely drawing some 3mt this year, or circa 300-400kt per month from April to December, creating massive futures buying demand as inventory hedges are lifted. Pre-shock inventories were already around lows of the last 55 years of data, Citi notes.
There is no spare capacity, with supply constrained by government policy and competition for power from data centres. Citi points out the cost of aluminium’s main substitutes, copper and plastics, are at or near all-time highs.
The aluminium market was already tightening into this shock, with production growth slowing relative to demand.
A memorandum of understanding or actual deal that leads to partial or full reopening of the Strait of Hormuz would be extremely bullish, Citi suggests, as it would raise certainty about demand growth medium term, as would more aluminium smelter closures or damage if followed by an MOU/deal.
Citi believes China’s current aluminium capacity cap is unlikely to be raised during 2026, or 2027. China is pursuing an “anti-involution” (anti overcapacity) strategy broadly across energy transition sectors, and the aluminium industry is the “poster child” for what a successful crackdown on overcapacity looks like.
China is short aluminium raw materials and highly dependent on one country, Guinea, and is therefore incentivised to find demand substitutes rather than build out more supply in face of shortages of aluminium.
Magnesium, which China is long, can be used in solar panel frames instead of aluminium and will be a key beneficiary, Citi suggests.
There are ambitious plans to build primary aluminium smelters in Indonesia, driven both by push factors (China’s capacity cap) and pull factors (Indonesia’s ban on bauxite exports).
Chinese producers may also see this as a critical step to diversify supply risk, Citi suggests, due to China’s heavy reliance on bauxite supply from Guinea.
But while Indonesia is emerging as the only meaningful source of ex-China supply growth, the absolute scale of additions remains limited.
Find out why FNArena subscribers like the service so much: “Your Feedback (Thank You)” – Warning this story contains unashamedly positive feedback on the service provided.
FNArena is proud about its track record and past achievements: Ten Years On
Click to view our Glossary of Financial Terms
CHARTS
For more info SHARE ANALYSIS: IGO - IGO LIMITED

For more info SHARE ANALYSIS: LTR - LIONTOWN LIMITED
For more info SHARE ANALYSIS: MIN - MINERAL RESOURCES LIMITED
For more info SHARE ANALYSIS: PLS - PLS GROUP LIMITED
For more info SHARE ANALYSIS: PMT - PMET RESOURCES INC