
Technicals | 1:46 PM

This story features MINERAL RESOURCES LIMITED.
For more info SHARE ANALYSIS: MIN
The company is included in ASX50, ASX100, ASX200, ASX300 and ALL-ORDS
MinRes shares look oversold, The Chartist reports, but sellers remain the dominant driver for the time being.
By The Chartist
Technical discussion
Reasons to be cautious:
- Onslow Iron’s ramp-up and Mining Services volumes should drive stronger cash generation.
- The above should also go some way towards repairing the balance sheet.
- Fuel prices are having a negative impact.
- Diversification across mining services offers more stable earnings.
- A straight-line leg lower is in motion.
Most companies with exposure to iron ore or lithium have been under pressure over the past few months. Both have been heading lower within intent.
Unfortunately, Mineral Resources ((MIN)) has exposure to both. As such, it shouldn’t come as a big surprise that the sell-off over the past few months has intensified.
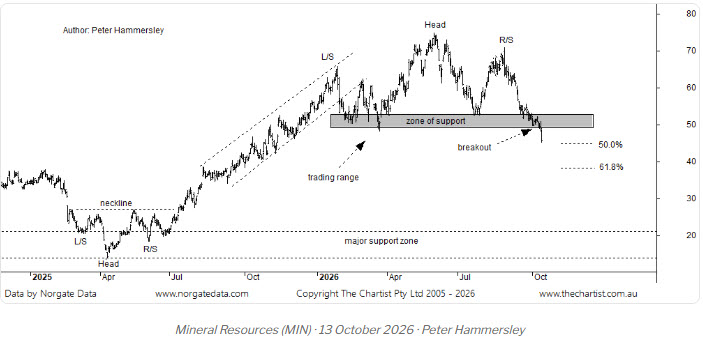
From the pivot high made on the 27th of August, the company has declined by -35% to current levels. It may not seem like a massive number, but within that timeframe, it’s something that can’t be ignored.
Today’s weakness has taken price beneath the lower boundary of a zone of support. Unless buyers step up immediately, it could become resistance within a matter of days.
That would be the worst-case scenario, as it would pave the way for a more significant downtrend. Either way, unless the Materials sector can kick back into life, it’s going to be an uphill struggle for Mineral Resources over the coming weeks.
Our last review was in late August. There’s been little reason to take another look due to the lack of symmetry, especially from an Elliott Wave perspective. There would be no benefit in trying to force a wave count on the chart just for the sake of it. It wouldn’t help with the analysis.
However, I have put forward the 50%–61.8% retracement zone. We can still use Fibonacci ratios in isolation. The current leg South has taken the stock to within touching distance of the upper boundary of that target area.
If there is to be a rally, it could well commence in that zone, sitting on either side of $40.00. It’s not to say a major low will lock in at those slightly lower levels, but it could produce a respectable rally. One thing is for sure; for now, sellers are in total control.
Not surprisingly, the potency of the current sell-off has resulted in our divergence oscillator on both the daily and weekly charts sitting in the oversold position. There’s even minor bullish divergence on this daily timeframe, yet it’s not a textbook example.
It’s a shallow pattern, plus it’s yet to trigger. In fact, price would need to head higher immediately for that to be the case. Whilst nothing is impossible, it’s difficult to envisage today’s low being a major turning point.
As we touched on above, demand is lacking, and the speed of the retracement has accelerated. Interestingly, out of the 5 brokers that have covered the company since late August, all are bullish, suggesting it’s undervalued.
That may well be the case fundamentally, but the patterns don’t lie. At this stage, it would be impossible to align ourselves with their views from a technical perspective.
Trading strategy
There’s no doubt that a snap-back reversal could unfold at any time. However, trying to ascertain when that time will be, and from what levels, is impossible to tell.
Yes, we have the typical retracement zone to keep an eye on, but there are no guarantees that it will attract buyers.
As such, there is no compelling reason to want to be involved from a trading perspective. It’s a trait that’s unlikely to change any time soon.
Re-published with permission of the publisher. www.thechartist.com.au All copyright remains with the publisher. The above views expressed are not by association FNArena’s (see our disclaimer).
This report may contain advice that has been prepared by The Chartist Pty Ltd (ABN 40 641 323 051). The Chartist Pty Ltd is a Corporate Authorised Representative (CAR No. 1282007) of Shartru Wealth Management Pty Ltd ABN 46 158 536 871, AFSL 422409. Any advice is considered general advice and has been prepared without taking into account your objectives, financial situation or needs. Because of that, before acting on this advice you should therefore consider the appropriateness of the advice having regard to your situation and your own objectives, financial situation and needs. We recommend you obtain financial, legal and taxation advice before making any financial investment decision. If the advice relates to the acquisition, or possible acquisition, of a product (other than a security e.g. a CFD) then the client should obtain the relevant Product Disclosure Document and consider it before making any decision about whether to acquire the product. Past performance is not a reliable indication of future performance. This material has been prepared based on information believed to be accurate at the time of publication. Subsequent changes in circumstances may occur at any time and may impact the accuracy of the information.
Risk Disclosure Statement
THE RISK OF LOSS IN TRADING SECURITIES AND LEVERAGED INSTRUMENTS I.E. DERIVATIVES, SUCH AS FUTURES, OPTIONS AND CONTRACTS FOR DIFFERENCE CAN BE SUBSTANTIAL. YOU SHOULD THEREFORE CAREFULLY CONSIDER YOUR OBJECTIVES, FINANCIAL SITUATION, NEEDS AND ANY OTHER RELEVANT PERSONAL CIRCUMSTANCES TO DETERMINE WHETHER SUCH TRADING IS SUITABLE FOR YOU. THE HIGH DEGREE OF LEVERAGE THAT IS OFTEN OBTAINABLE IN FUTURES, OPTIONS AND CONTRACTS FOR DIFFERENCE TRADING CAN WORK AGAINST YOU AS WELL AS FOR YOU. THE USE OF LEVERAGE CAN LEAD TO LARGE LOSSES AS WELL AS GAINS. THIS BRIEF STATEMENT CANNOT DISCLOSE ALL OF THE RISKS AND OTHER SIGNIFICANT ASPECTS OF SECURITIES AND DERIVATIVES MARKETS. THEREFORE, YOU SHOULD CONSULT YOUR FINANCIAL ADVISOR OR ACCOUNTANT TO DETERMINE WHETHER TRADING IN SECURITIES AND DERIVATIVES PRODUCTS IS APPROPRIATE FOR YOU IN LIGHT OF YOUR FINANCIAL CIRCUMSTANCES.
Technical limitations If you are reading this story through a third party distribution channel and you cannot see charts included, we apologise, but technical limitations are to blame.
Find out why FNArena subscribers like the service so much: “Your Feedback (Thank You)” – Warning this story contains unashamedly positive feedback on the service provided.
FNArena is proud about its track record and past achievements: Ten Years On
Click to view our Glossary of Financial Terms
CHARTS
For more info SHARE ANALYSIS: MIN - MINERAL RESOURCES LIMITED
