
International | 10:44 AM

Weekly Yield Curve analysis and commentary from Weekly Market Reports:
- US Treasuries aggressively repriced the Fed tightening outlook last week
- 12% to 15% probability ascribed to a 50-basis-point hike in December
- Fixed interest experts cannot agree on whether long bond yields have peaked, or not
- Australia's 10-year yield now below US benchmark
- Traditional cross-asset relationships are shifting
The following article is contributed by Pete from Weekly Market Reports, an independent macro research publisher.
For months, fixed-income traders debated whether easing energy shocks and weak money growth would allow the Federal Reserve to pause its tightening campaign.
During the second week of November 2026, the US Treasury market settled that argument with a decisive capitulation.
A violent bear-flattening wave swept across the yield curve between November 6 and November 13, driven by the sharpest front-end sell-off in decades.
Rather than waiting for long-term growth to cool inflation, bond investors are now rapidly repricing for an aggressive policy response that is already sending tremors through global sovereign curves and corporate credit.
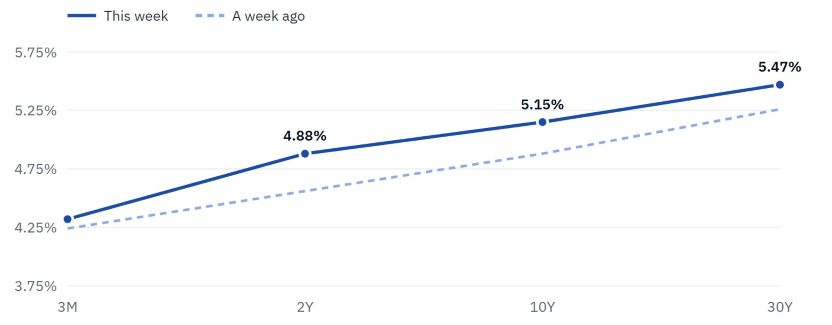
Chart 1. The US Treasury yield curve, this week against a week ago. Source: Weekly Market Reports.
The Capitulation at the Short End
The catalyst for this repricing arrived with October inflation numbers that exceeded consensus estimates. According to Reuters data from November 10, headline CPI rose 0.4% month-over-month against a 0.3% forecast, while core CPI climbed 0.3% compared to an expected 0.2%.
Coupled with moderately rising producer prices, strong payrolls, and Governor Waller’s conditional support for a 50-basis-point move in December, the inflation print eliminated any lingering hopes for monetary leniency.
On November 10 alone, the 2-year Treasury yield surged about 18.4 basis points to 4.731%, marking its largest single-day jump since April 2025.
By the end of the week on November 13, the 2-year yield had climbed 32 basis points—or 7.02%—to close at 4.88%.
In contrast, the 3-month bill rose a modest 8 basis points (1.89%) to 4.32%, indicating that while immediate overnight liquidity remains relatively unstressed, expectations for upcoming policy meetings have shifted dramatically.
According to CME FedWatch figures cited by FXStreet, a 25-basis-point rate hike at the December 8–9 Federal Reserve meeting is now priced at roughly 86% to 88%.
More significantly, the market has introduced a 12% to 15% probability of a 50-basis-point hike in December, alongside three additional quarter-point hikes by mid-2027.
With the standard quarter-point move almost entirely baked into current prices, the primary upside risk to short-term yields now rests on that 50-basis-point tail—a scenario that could push the 2-year yield past 5%—or a sudden dovish reversal if upcoming commentary from Fed speakers like Williams, Collins, Logan, Bowman, or Daly softens.
Anatomy of a Bear Flattener
While the short end led the sell-off, longer maturities were pulled higher in its wake, albeit at a slower pace. Over the week, the 10-year yield advanced 27 basis points (5.53%) to 5.15%, and the 30-year yield rose 21 basis points (3.99%) to reach 5.47%.
Because front-end yields rose faster than long-end rates, the yield curve remained positively sloped but compressed noticeably. The widely watched 2s10s spread narrowed from 32 basis points a week earlier to 27 basis points, while the 10s30s spread contracted from 38 basis points to 32 basis points.
Looking back to October 15, 2026, when the 2-year stood at 4.74% and the 10-year at 5.09%, the past month has delivered a 14-basis-point rise in the short end against just 6 basis points in the 10-year.
Compared to a year ago, when yields across all maturities sat between 3.5% and 4.5%, the entire curve has undergone a massive upward shift.
Institutional observers remain divided on whether long-term rates have found a ceiling. Goldman Sachs suggests the 10-year yield will remain below recent highs around 5.3%, arguing that supply pressures, term premium, and convexity selling are unlikely to align simultaneously.
Conversely, T. Rowe Price contends that yields have not peaked and that persistent inflation—rather than fiscal deficits—could push rates higher and potentially invert the curve.
While the 10-year remains beneath its October peak of 5.36%, weak long-end auction metrics validate ongoing structural pressure, notably a 30-year auction that stopped at 5.441% with a 0.4-basis-point tail and a 2.36x bid-to-cover ratio.
Collateral Damage in AI Credit and Global Curves
A 2-year Treasury yielding 4.88% does more than reflect Fed policy; it drains capital from riskier segments of the financial system. That drain is colliding directly with an unprecedented wave of technology borrowing.
According to WallStreetCN, hyperscalers issued US$67 billion in bonds in a single week, bringing year-to-date issuance to roughly US$296 billion—shattering Goldman Sachs’s full-year 2026 ceiling of US$25 billion.
Federal Reserve Vice Chair Bowman noted that AI-related debt is on track to exceed US$800 billion this year, with risks concentrated among a few large AI-service firms. As a result, new-issue concessions for AI borrowers are repricing, and both investment-grade and high-yield credit spreads are hovering near their March highs.
Simultaneously, the Fed’s trajectory is fracturing international rate correlations. While markets price at least 75 basis points of Fed tightening by the third quarter of 2027, the Reserve Bank of Australia recently delivered a dovish hike to 4.85% and dropped its tightening forward guidance.
Consequently, Australia’s 10-year yield dipped 2 basis points below the US 10-year in early Sydney trading, setting up the first sub-US close since August 2025.
Even traditional cross-asset relationships are shifting: oil has lost its correlation with Treasury yields, leaving inflation data, upcoming 10-year auctions, and corporate credit stress as the central gauges for where the curve moves next.
Pete writes for Weekly Market Reports, an independent macro research publisher; its weekly Yield Curve report is free at weeklymarketreport.com/yield-curve.
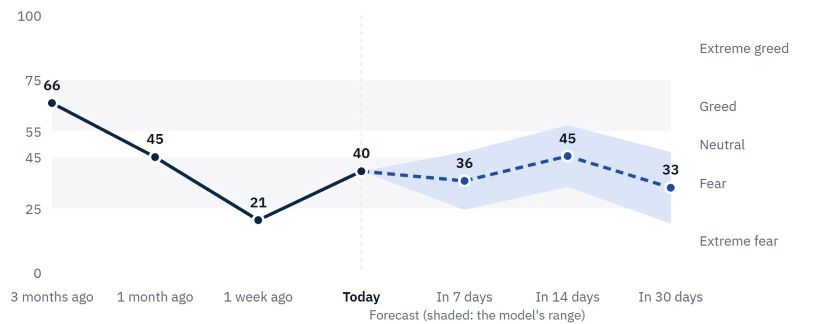
Chart 2. Our Fear & Greed index: the reading and the model’s forecast. Source: Weekly Market Reports.
Technical limitations
If you are reading this story through a third party distribution channel and you cannot see the charts included, we apologise, but technical limitations are to blame.
Find out why FNArena subscribers like the service so much: “Your Feedback (Thank You)” – Warning this story contains unashamedly positive feedback on the service provided.
FNArena is proud about its track record and past achievements: Ten Years On
FNArena content is produced by real people. We use AI tools to assist with grammar checks, research verification and internal processes. Our experienced editorial team follows financial markets closely, identifies valuable insights from research reports and retains full responsibility for editorial decisions and published content.