FYI | Feb 01 2010

This story features WORLEY LIMITED, and other companies.
For more info SHARE ANALYSIS: WOR
The company is included in ASX100, ASX200, ASX300 and ALL-ORDS
(This story was originally published on Wednesday, January 27, 2010. It has now been republished to make it available to non-paying members at FNArena and readers elsewhere).
Stockbrokers and market commentators elsewhere have done their best in convincing their clientele and readers that weakness experienced in prices for equities and commodities over the week past is nothing but a buying opportunity. I dare to differ. I believe what we are witnessing throughout the month of January marks a thorough and fundamental change in the underlying trend for risk assets.
While this implies that the strong uptrend in place since the first quarter of 2009 has now -abruptly- come to an end, I do not side with the army of doom and gloom preachers suggesting prices for oil and copper, as well as major equity indices are now irrevocably on their way back to pre-March-rally lows. But investors should take today’s message seriously nevertheless: the trend of ongoing monthly gains for risk assets is no longer in place.
As such, calendar 2010 will bring something to the mix investors have not experienced since March last year (ten months ago, January not included): share markets will experience months during which losses will be booked on a net basis. It may well be that January, the first month of the new year, will be the first to mark this reversal in trend.
Readers who have been reading my stories and analyses this month already know I have been warning repeatedly of this reversal as valuations overall were looking rather full for market leaders in the US and Australia. On top of this, I was convinced that junior traders and hedge funds had used the quiet period between Christmas and the second week of January to push up prices for equities and commodities too far.
To put it simply: oil does not yet deserve to be trading at US$84/bbl, copper should be nowhere near US$8000/tonne and Australia’s leading indices reaching out for 5000 in early January seems a bit (too) rich too.
The irony of all this is, of course, that global economies today seem in a much better place compared with last year, while US companies are finally making advances in profits again (after nine consecutive quarters of declining profits). The key phrase behind today’s asset prices, however, is not necessarily “economic recovery”, but rather “abundant liquidity”.
Those who say that January’s price weakness is but a buying opportunity focus on the first phrase. I however say: be careful, because it is the second factor that can bring potentially very damaging side-effects to this year’s mix of events. At a time of elevated asset prices, all markets needed was a trigger to reverse course.
It would seem this trigger came at least in threefold: problems in Greece that in effect prove the GFC is not history just yet, tightening measures in China, and a struggling US president who declared war on greedy bankers and speculators to help turn around the political tide and his sinking approval ratings.
The Big Question that is poised to come to the fore this year is whether last year’s easy speculation in risk assets will turn out to be a major negative in 2010. As far as market positioning goes: too many investors, big and small, have their portfolios weighted too much in favour of cyclical leverage, in effect going short US dollar and Japanese Yen and long (nearly) everything else from oil to copper, to gold, to the Australian and Canadian dollars, to Emerging Markets and equities on Wall Street.
Secondly, too much liquidity, in China and elsewhere, has found its way in commodity markets where a big chunk of last year’s “apparent demand” has ended up in stockpiles of which nobody knows what, where and how much has been stockpiled along the way. Today’s prime example of this is crude oil. The world’s producers are currently producing more than what is being consumed, resulting in stockbrokers and financiers renting large ships to store oil in order to benefit from price rises later.
Under normal circumstances this would be enough for investors to push oil prices down, but in today’s context wherein everybody is convinced crude oil prices will return to US$100/bbl and higher in calendar 2011 (at the latest), investors simply cannot help themselves other than to seek exposure to the simply-cannot-fail future upside of crude oil prices.
The problem is that so many investors all seek the same exposure at the same time. Sounds familiar? Think gold in October last year. Or oil in the second quarter of 2008.
This was once again demonstrated by UBS’s measurement of global risk appetite. The index jumped into “extreme” territory in December last year and simply refused to come down, indicating markets overall were once again running hot on too much optimism and adrenalin. Over the past week this index has dived lower, but it still remains in positive territory.
What has caught my attention over the past ten days or so (apart from stockbrokers telling their clients this is an opportunity to buy) is that financial markets across the globe have started to break through well-established trend lines that find their origin in the first quarter of 2009. I can only describe this as a major development. It should instantly attract every investor’s full attention.
For someone who doesn’t see himself as a technical analyst (and I am not) I have spent an inordinate amount of time these past days, staring at one year price charts for all sorts of assets, markets, indices and share prices. The reason I did this was because I had observed that global share markets had started to break below these trend lines. As weakness has persisted, commodity indices such as the Reuters Jefferies CRB Index have now also broken below their year-long support line.
At the very least this indicates that the trend in place since March 2009 has now ended. Full stop.
Here’s an example of what I am talking about:
What are the possible implications? Under the most positive scenario this break in trend could prove temporarily only. As an example, in late 2003 (late stages of the 2000-2003 bear market) the Australian share market equally broke through its longer term trend line, after which the market broadly traded sideways for a while, albeit with a slight positive bias. One year later a new bull market was born and the share market never looked back, until late 2007.
A more common scenario, but not necessarily a blue print for the future, is the one provided by the EUR/USD. The cross broke through its trend line in early December last year and it has simply moved into the opposite direction ever since. If one ever wants to see a decisive change in trend, EUR/USD is one to look at today.
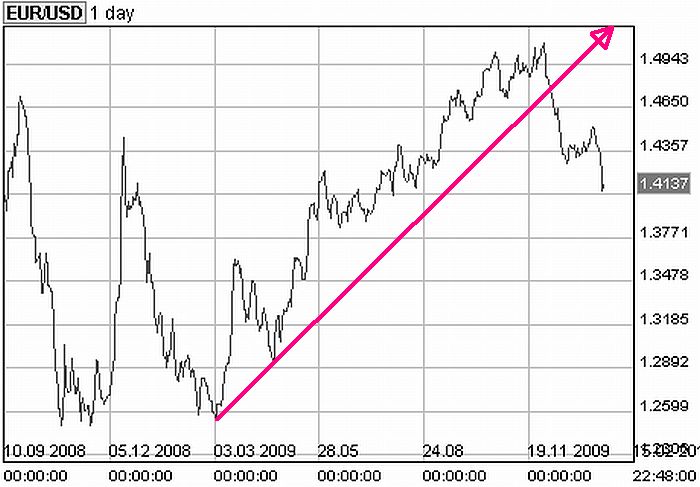
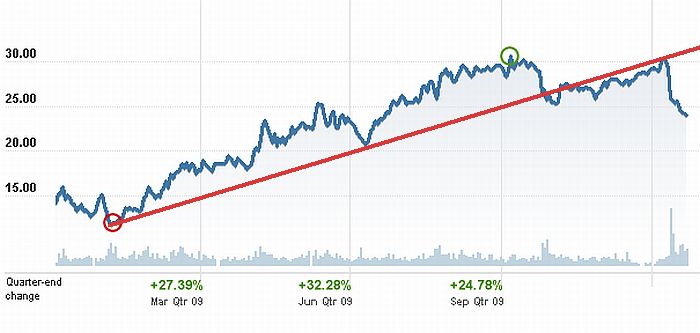
An interesting alternative is provided by WorleyParsons ((WOR)). When looking at its price chart, one can see how investors for an extended time simply refused to accept that the underlying trend for the shares had changed, resulting in the shares oscillating around the rising trend line. This is similar to what happened with the EUR/USD in 2008. As one can see from the chart below, ultimately, however, this always ends with a much steeper decline. This was also the case for EUR/USD in 2008.
Conclusion: a major trend has been broken in a decisive manner. We will have to find out what exactly will be the new trend, but we know the old one is no longer in place.
Are shares and commodities now being transformed into a buying opportunity? That depends on one’s horizon and goals, but I am pretty certain it won’t be the case for all shares and not for all commodities either.
One observation I have made is that many leading large caps in Australia have not yet broken through their trend lines. BHP Billiton ((BHP)), for instance, is still priced above $40 and Commbank ((CBA)) remains above $52. Some stocks, such as Leighton Holdings ((LEI)) and Qantas ((QAN)) could potentially experience a lot of weakness and still remain on the positive side of their trend lines.
For others, such as WorleyParsons (see above) and Boral ((BLD)) the reversal in trend has already occurred.
Special note for paying subscribers: I will follow up on this story with many more charts and graphs, if not on Thursday, then on Friday. Check the website if you haven’t set any email alerts.
With these thoughts I leave you all this week,
Till next week!
Your editor,
Rudi Filapek-Vandyck
(as always firmly supported by the Ab Fab team at FNArena)
P.S. For the newcomers who have yet to catch up with my track record of the past few years: in June of 2007 I warned prices for uranium had peaked and weakness should be expected. At the time, spot uranium was at US$138/lb. Today it is at US$42.50/lb.
Later that year I stated analysts and economists worldwide were severely underestimating the true nature and impact of the subprime crisis in the US. From that moment on I declared all Australian banks should be regarded a Sell.
In late 2007 I concluded the market was looking expensive, though I did not foresee the savage downturn that was about to follow.
In the second quarter of 2008 I warned everyone that oil at such elevated prices would not be sustainable. Don’t buy any oil stocks, I warned readers and subscribers at FNArena. Unfortunately, most would ignore my warning and go with the ruling market view.
In late August that year I predicted the most severe correction for commodities in human memory was about to unfold. Those readers and subscribers who acted on my warning still approach me and shake my hand whenever they see me at a conference or trade show.
In June last year I turned positive on global equities, Australian banks in particular. (I had predicted a rally for March, but had my doubts whether it would prove to be a lasting one).
Now it’s January 2010 and once again I had to conclude that prices for commodities and share markets had run too high, too quickly. Today I conclude the firm trend in place since Q1 last year is now broken and no longer in existence.
P.S. I – All paying members at FNArena are being reminded they can set an email alert for my editorials. Go to Portfolio and Alerts in the Cockpit and tick the box in front of Rudi On Thursday. You will receive an email alert every time a new editorial has been published on the website.
Click to view our Glossary of Financial Terms
CHARTS
For more info SHARE ANALYSIS: BHP - BHP GROUP LIMITED

For more info SHARE ANALYSIS: CBA - COMMONWEALTH BANK OF AUSTRALIA
For more info SHARE ANALYSIS: QAN - QANTAS AIRWAYS LIMITED
For more info SHARE ANALYSIS: WOR - WORLEY LIMITED