Technicals | 10:00 AM

Crude oil futures expiring in May represent potential shock for financial markets, DeCarleyTrading.com's Carley Garner warns.
By Carley Garner, DeCarleyTrading.com
The two biggest precursors to a recession are an inverted yield curve and a sharp spike in oil prices. We are now contending with both.
The 10-year yield was lower than the 2-year yield (inverted) from mid-2022 through mid-2024. This was the longest and deepest inversion on record.
When short-term rates exceed long-term rates, it suggests that market participants favor long-term bonds as a hedge against potential future economic turmoil.
Despite the recent 26-month inversion, this is a relatively rare occurrence.
A yield curve inversion has preceded every major U.S. recession since at least the late 1960s. Most economists agree that it predicted 7 of the last 8 recessions, for an 87.5% hit rate.
Post-inversion yield curve recession generally comes 6 to 24 months after the initial inversion.
The one inversion that didn’t result in a full-blown recession was in 1966, but it was accompanied by a mild economic slowdown.
We are left with the question: is this a rare 1966 false-signal repeat, or are we on the brink of a delayed recession?
You have likely noticed we are outside of the typical post-inversion recession window, but perhaps that can be explained away by the unprecedented liquidity stimulus and the wealth effect, compliments of the AI boom.
Very few economists are calling for a recession, but to be fair, they were mostly all calling for a recession in 2023, and it never came, at least not after the definition of recession was slightly altered to disguise it.
We wouldn’t be talking about the yield curve inversion and its implications today if it weren’t for crude oil.
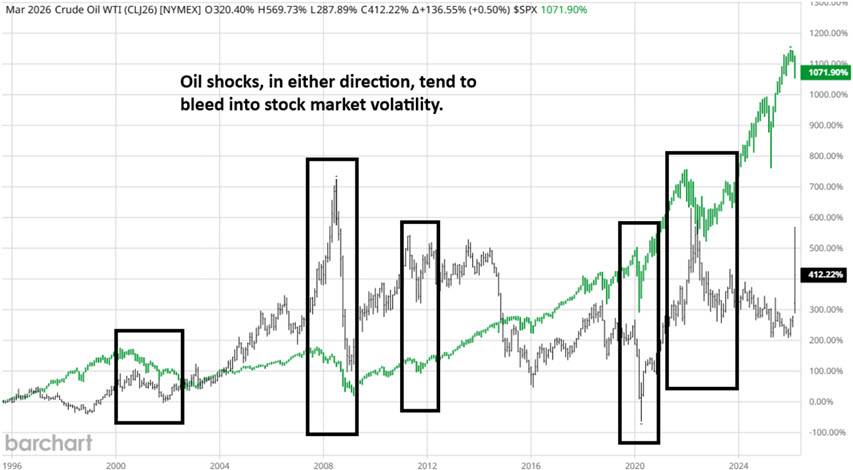
Oil spikes of this caliber have always accompanied stock market sell-offs and, more generally, economic slowdowns.
Unlike yield curve inversions, oil price spikes are generally triggered relatively quickly, not a year or two later.
This is because when gas prices double, it immediately takes money out of consumers’ pockets, slows travel (higher airline tickets), and puts businesses in a defensive posture rather than an offensive one.
Oil has traveled from the mid-US$50.00s to a peak of US$120.00 in the first three months of 2026. This is enough to break things.
However, while I believe the longer-term prospects for oil are bearish (under US$50.00 and maybe even US$30.00), what happens in the next few weeks is highly uncertain and, to be honest, could be scary.
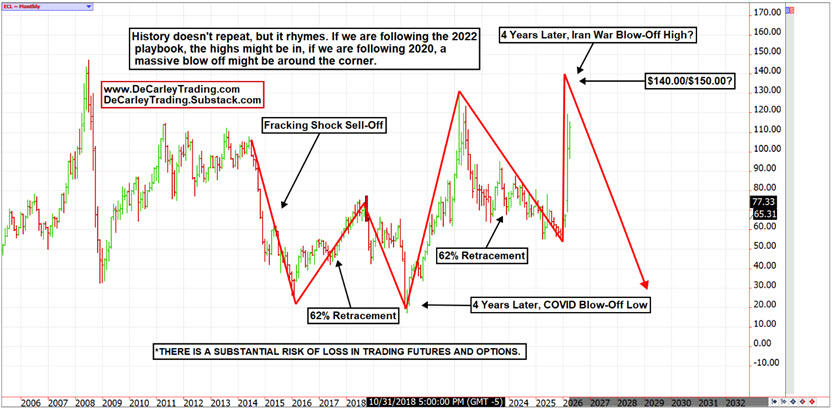
If the oil market is following the 2022 high, the highs are likely in or near. But if the oil market is following the 2020 playbook, we could be in store for a wild short squeeze into the May contract expiration.
I am not bullish, but I recognize there is an incoming liquidity problem with the May contract expiration. It increasingly looks like we are following the 2020 bear cycle in reverse.
The initial 2014 fracking sell-off was followed by a 62% rally, then a stunning decline to new lows 4 years later (the front month, May, went negative just prior to expiration).
The rally from the 2020 low ran through 2022, then retraced by -62%. If we are following the 2020 pattern in reverse, we will top out 4 years later (now’ish) in an explosive new high.
We don’t think this high will occur in the back months, but the May contract might see a massive short squeeze pulling it into the US$140.00/US$150.00 area.
I hope I am wrong. Futures rollovers are often hectic, but rollovers amidst massive event risk can be catastrophic.
This is how we ended up with a May 2020 futures contract that traded below zero by -US$40.00+.
Whether you are an oil bull or a bear, now is not the time to swing for the fence.
Unlimited risk positions on both sides of the market are subject to unusual volatility akin to the 2020 oil market or, more recently, what we saw in January in gold and silver.
Please keep risk in check; keeping chips on the table will be the name of the game in the coming weeks.
****
DeCarley Trading (a division of Zaner)
Twitter:@carleygarner
info@decarleytrading.com
www.DeCarleyTrading.com
www.TradingCommodityOptions.com
www.HigherProbabilityCommodityTradingBook.com
Re-published with permission. Views expressed are not by association FNArena’s.
Technical limitations
If you are reading this story through a third party distribution channel and you cannot see charts included, we apologise, but technical limitations are to blame.
Find out why FNArena subscribers like the service so much: “Your Feedback (Thank You)” – Warning this story contains unashamedly positive feedback on the service provided.
FNArena is proud about its track record and past achievements: Ten Years On