Technicals | 10:30 AM

Earlier today, Tony Sycamore, Market Analyst, IG updated his views and thoughts on financial markets, including the technical analysis.
By Tony Sycamore
All material has been re-published with permission and does not by association represent FNArena’s views (we have none, we simply report).
First Up, Nasdaq100
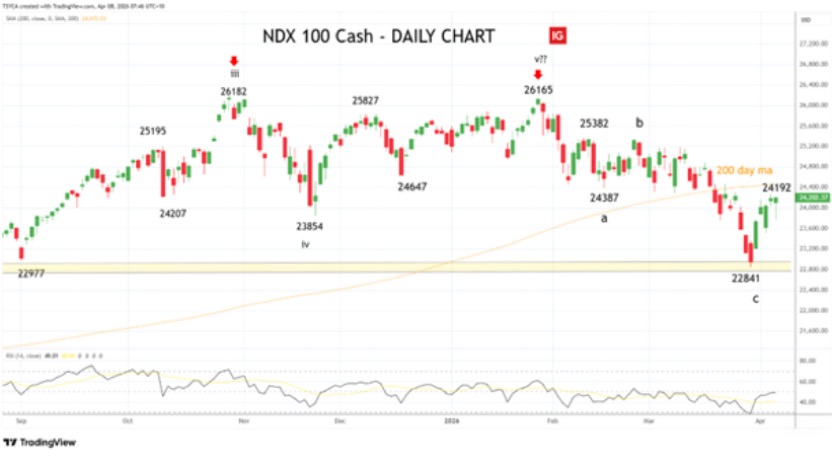
The Nasdaq100 commenced a correction after reaching its late-October peak at 26,182, a move that was later re-inforced by a clear double top near 26,165 in late January.
The correction gained momentum in late March as the index broke decisively below its 200-day moving average, followed by a break of the November 21 low at 23,854 to reach the initial downside target of 23,000.
While the recent five-session bounce from the 23,000-support zone has significantly eased immediate downside risks, the index still needs to reclaim the key resistance area around 24,500ish, which includes the 200-day moving average at 24,472 and a wall of horizontal resistance.
This would confirm the correction from the 26,182 high is complete at the recent 22,841 low print and the broader uptrend has resumed, targeting a retest of the 26,182 high.
Aware that until the resistance at 24,500ish is cleared, further weakness remains possible, including a retest of support at 23,000–22,800.
A break below this level would open the door to a deeper decline toward the 22,200–22,000 zone.
ASX200
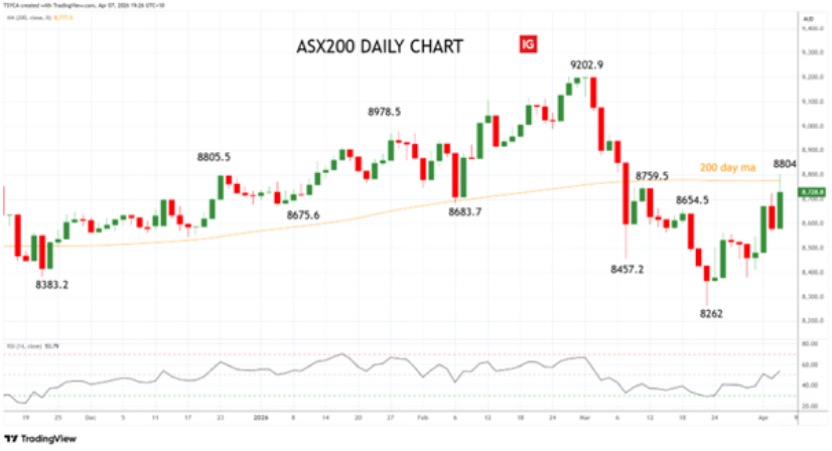
At the 8262 low of late March, the ASX200 has fallen -940 points or a neat -10.20% from the 9202.9 record high it struck in late February.
The ASX200 must reclaim the 200-day moving average currently at 8777 on a sustained basis to increase confidence a medium-term low is in place at the 8262 low and the uptrend has resumed.
Until then, a retest and break of the 8262 low is possible.
Crude Oil
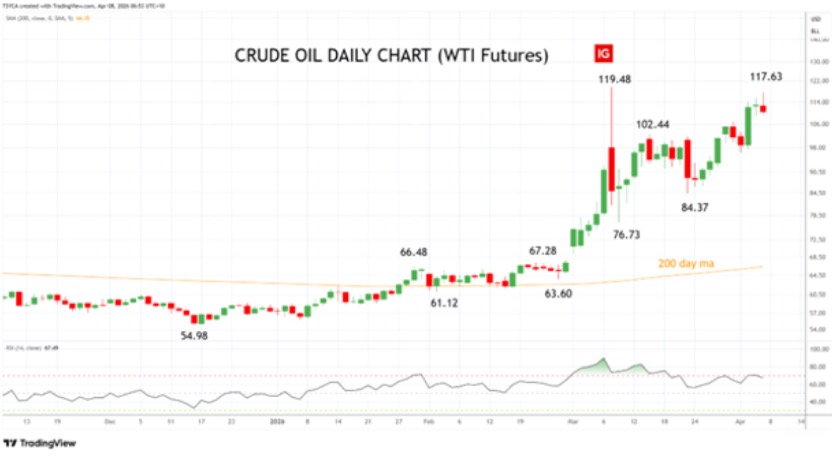
WTI Crude Oil is trading lower at US$110.34 (-2.02%), pulling back sharply from an earlier session high of US$117.63.
The -6.2% intraday reversal lower was triggered by a last-minute peace plan floated by Pakistan. The proposal, which has reportedly been received positively by Iran and is now under consideration by the US, centres on three key points:
- a two-week opening of the Strait of Hormuz,
- a reciprocal two-week extension of President Trump’s deadline to bomb Iranian energy infrastructure and bridges,
- and a comprehensive two-week ceasefire across the board.
However, these ongoing diplomatic deliberations haven’t completely halted the military action.
Just recently, reports emerged of a joint US-Israeli strike on IRALCO in Arak, Iran’s largest aluminium producer and a key supplier of materials used in missile casings, drones, and centrifuge components.
While a temporary two-week opening of the Strait would only allow for a modest resumption of global oil flows, it would be a very welcome development if it ultimately paves the way for a broader, permanent reopening.
Looking ahead to today’s session, If a ceasefire is agreed upon, thereby averting a major escalation we would likely see WTI drift back down towards the US$100 level.
Conversely, a breakdown or outright rejection of the peace plan by the US would almost certainly see crude oil rebound sharply back toward US$120.
Gold
Gold is trading higher at US$4704 (1.18%) catching a bid on the back of the last-minute peace plan floated by Pakistan.
If this two-week proposal ultimately paves the way for a permanent ceasefire, it will undoubtedly strip out a portion of the geopolitical risk premium that has been heavily baked into the gold price.
On the flip side, a sustained de-escalation would also likely lead to lower oil prices and ease lingering inflation fears.
This, in turn, would quickly revive market expectations for Federal Reserve rate cuts later in 2026, a positive tailwind for the yellow metal that should help offset the loss of safe-haven flows.
From a technical perspective, the picture remains constructive.
Providing gold holds firmly above the 200-day moving average, currently at US$4152 and reinforced by the recent US$4098 low, we continue to look for a steady grind higher, initially targeting a test of the US$5000/oz level.
Technical limitations
If you are reading this story through a third party distribution channel and you cannot see charts included, we apologise, but technical limitations are to blame.
Find out why FNArena subscribers like the service so much: “Your Feedback (Thank You)” – Warning this story contains unashamedly positive feedback on the service provided.
FNArena is proud about its track record and past achievements: Ten Years On