Technicals | Jul 01 2026

Earlier today, Tony Sycamore, Market Analyst, IG updated his views and thoughts on financial markets, including the technical analysis updates.
First Up, Nasdaq100
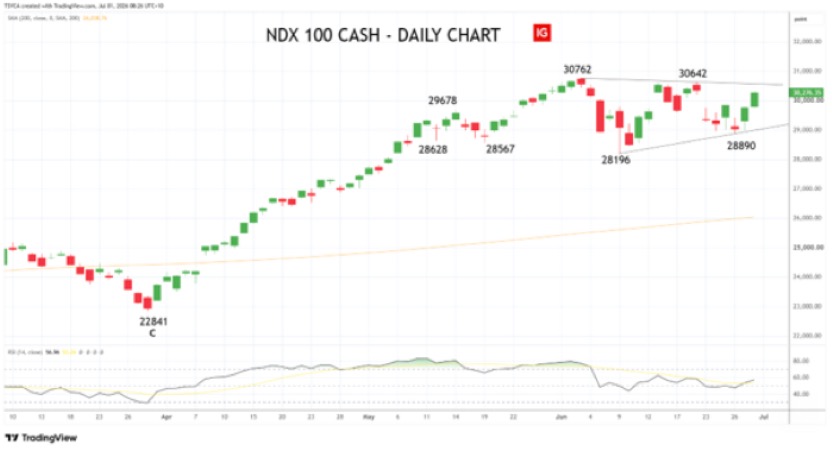
From its late-March low of 22,841, the Nasdaq100 commenced a 35% rally in just over nine weeks to reach a record high of 30,762 in early June.
The rally was in line with our bullish calls, although it did hit the 30,000 target some six months earlier than we were expecting.
In that context, the current pullback is hardly surprising, and the correction continues to evolve.
A decisive break and close above the 30,642–30,762 zone would signal the correction is complete and target a retest of the all-time highs, before a push towards 31,500.
Conversely, a break back below the recent 28,890 would open the door to a deeper pullback toward the June low 28,200/28,000 area.
ASX200
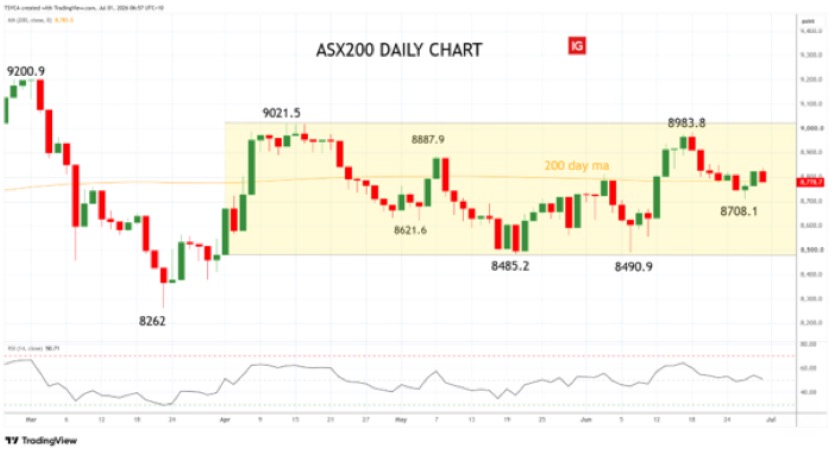
The rejection from the mid-June high of 8983.8 has seen the ASX200 remain confined to the broad 9000–8500 trading range it has occupied over the past 13 weeks.
Looking ahead, we see scope for this ASX200 to continue to trade sideways within this range for a few more weeks yet – while remaining opening minded as to what direction the break of the range will eventually come.
Crude Oil
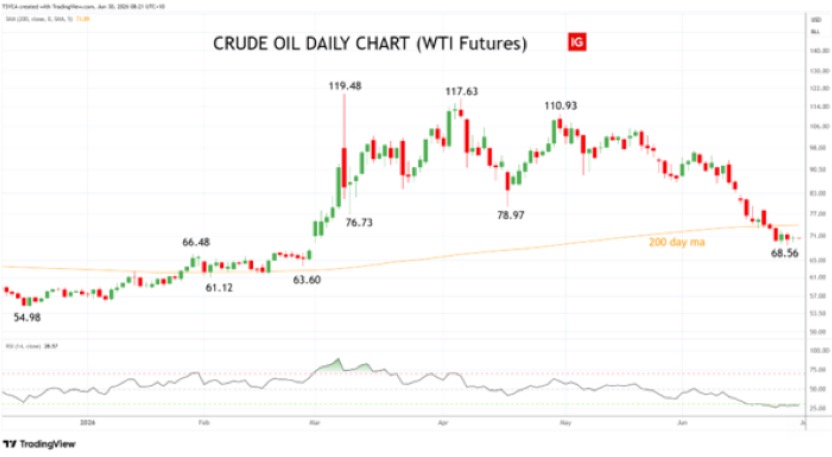
WTI Crude Oil finished lower overnight at US$70.03 (-0.55%) down -20% in June and a whopping -31% for the quarter — its worst three-month performance since the emergence of Covid in Q1 2020.
The sharp falls have been driven by a swift increase in oil flows out of the Persian Gulf following the interim ceasefire and the lifting of the US naval blockade on Iran.
Tanker tracking data shows Iran alone has exported around 50 million barrels since the restrictions eased roughly two weeks ago. Much of that volume appears headed toward Asia, particularly China.
Looking ahead, if the Strait of Hormuz continues with an uneven but progressive re-opening —which I’d assign an 85% probability to— the current price around US$70 appears reasonable with a downward bias.
The bigger risk is a flare-up that reignites the conflict. That scenario is clearly the lower-probability outcome at present —likely in the 10-15% range— but it is far from negligible.
In that environment, current prices are way too cheap. Given the skew in probabilities, any positioning for upside risk is probably better expressed through options upside structures rather than outright long positions.
Chart wise, crude oil is oversold but without a clear catalyst to test important resistance at US$74.00 coming from the 200-day moving average.
Gold
Gold finished lower overnight at US$4007 (-0.23%), down -11.74% in June and -14% for the quarter.
The metal has come under considerable pressure in recent months as the so-called debasement trade has lost momentum.
That narrative is built around expectations of persistent currency erosion through large deficits and loose policy, and has faced growing headwinds from shifting Fed rate expectations and a stronger US dollar.
Tomorrow night’s US Non-Farm Payrolls report has the potential to add further pressure if it reinforces a hawkish tilt from the Fed.
Large-scale ETF selling has been a clear driver behind the recent weakness.
Global gold-backed ETFs saw outflows of -38.3 tonnes last week — the largest weekly withdrawal since September 2022.
The largest US gold ETF alone saw -US$2 billion leave last week, contributing to a -US$3.2 billion outflow for the month of June so far. That retail and institutional selling stands in contrast to continued strong central bank buying.
Technically, while gold remains below the 200-day moving average at US$4477, the risks remain tilted toward a deeper pullback toward the October 2025 low of US$3886.
Below that level, there isn’t a great deal in the way of meaningful support until the US$3500 area from the April 2025 high.
All material has been re-published with permission and does not by association represent FNArena’s views.
Technical limitations
If you are reading this story through a third party distribution channel and you cannot see charts included, we apologise, but technical limitations are to blame.
Find out why FNArena subscribers like the service so much: “Your Feedback (Thank You)” – Warning this story contains unashamedly positive feedback on the service provided.
FNArena is proud about its track record and past achievements: Ten Years On