
Feature Stories | Aug 08 2008

By Greg Peel
The following quote on the state of the Australian economy is attributable to Dr Steve Keen, Associate Professor of Economics & Finance at the University of Western Sydney:
“Debt has reached unsustainable levels, and whether its reduction is done smoothly or abruptly, economic growth has to slow in the meantime. If households reduce their debt levels smoothly, they will have less disposable income to spend and retail sales will slump. If bankruptcies become widespread, the sales downturn will be overlaid with a financial crisis.
“A recession may have already started in the domestic economy, with only the China/India export boom masking the phenomenon.
“In this situation, doing anything – like increasing interest rates to ‘contain inflation’, will be worse than doing nothing at all.
“Paul Keating’s most famous aphorism, ‘the recession we had to have’, gave the 1990s recession an apt moniker. I fear that whatever policy is followed, the next recession will be will be known as ‘the recession we can’t avoid'”.
Speaking on ABC radio at the time, Dr Keen suggested that this recession is one to two years away. The time was November 2006, and Dr Keen’s analysis prompted FNArena to publish “Australia’s Unavoidable Recession” (Sell&Buyology; 15/11/06).
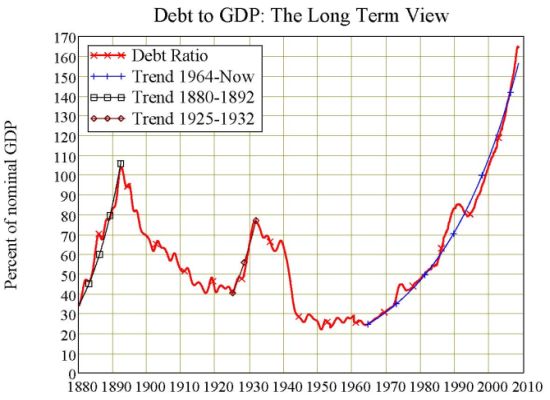
In November 2006 the Reserve Bank of Australia had just raised the cash rate to 6.25%. Dr Keen warned that raising the interest rate to avoid inflation was the wrong policy to pursue in the face of Australia’s overblown household debt burden, a burden that can be best appreciated by the following graph:
The RBA has since raised the cash rate four times to 7.25%. Dr Keen also warned that history proves initial central bank increases in interest rates, implemented with the intention of slowing the economy in the face of rising inflation, will only be met with initial increases in household debt, rather than reductions. This occurs largely for two reasons. Firstly, the first few interest rate rises do not automatically trigger household debt reduction, as they occur when the economy is strong and households do not see the need to panic. Secondly, a knee-jerk response is to cover debt with debt, for example switching to an “interest only” mortgage payment plan or using a credit card to buy the groceries when mortgage payments rise.
Only when reality sinks in and further rate rises have ensued, will households begin to appreciate they need to reduce debt. If rising inflation is the cause of interest rate rises, then the household will also be hit with a higher cost of living. This is the point where they will begin to rein in spending. The first sign of trouble as interest rates rise is that debt, or credit demand, will stop growing. The second is retail spending will begin to fall. An economy relies on both income-funded and debt-funded spending to grow.
By November 2006 the RBA had increased the cash rate eight times since the December 2001 low of 4.25%. Faced with spiraling inflation, and little sign that the economy was slowing (which included credit demand still rising), the RBA hiked four more times to March this year to a cash rate of 7.25%. But this month the landscape has suddenly changed.
Demand for credit has not only slowed, it has slowed dramatically and in some sectors turned negative. In June, economists were shocked when retail sales fell a lot more than expected. To Dr Keen, this is simply his prediction playing out. So what’s his latest prediction?
“A serious recession – the worst we have experienced since the Great Depression – is inevitable,” he says.
Of course, it has taken the global credit crunch – with its roots in US subprime mortgage securities – to get us to this point. However, the credit crunch was not just a lucky break for Dr Keen and his theories. In November 2006 the US housing market had already been slumping for a year and Americans had also previously driven household debt burdens to record levels. Dr Keen was expecting something to give in the US, but his biggest concern was that Australia’s debt burden had accelerated faster than US levels over the same period and that Australian house prices were still rising. Whatever was going to happen in the US, therefore, would only be magnified in Australia.
Nevertheless, the RBA has now clearly indicated that its tightening cycle is over and that the next move in rates will be down. Indeed, so sharp has been the Australian economy’s slowdown that economists are suggesting a full 50 basis point cut may be needed as early as next month. Dr Keen had suggested that it was the wrong policy to increase interest rates in the face of high debt levels, but now that the RBA is set to cut rates, the problem will surely be alleviated.
Or will it? Dr Keen in 2006:
“A borrowing binge only comes to an end when its adverse consequences can no longer be avoided. Then, when a slump follows a debt bubble, as in 1990, no amount of rate reductions can encourage borrowers to borrow. If interest rates are the RBA’s only policy weapon, then on the issue of private debt, it appears impotent.”
In January 1990 the RBA official cash rate was a range of 17-17.5%. The All Ordinaries Index had peaked in August 1989 following a partial recovery from the crash of 1987, and began a slide of 26% to December 1990, in synch with a collapse of the commercial property market. The RBA began cutting the cash rate, and kept cutting. It cut fourteen times until July 1993, at which point the cash rate bottomed at 4.75%. Yet Australia experienced a deep and dark recession during 1991-92. The banking sector was hardest hit, and Westpac nearly went under.
The All Ordinaries staged a 30% recovery from December 1990 to December 1991, but failed to regain the August 1989 high (36% was needed). Thereafter followed a long and torturous sideways drift in a minimal range as the recession played out. The 1989 high was not surpassed again until June 1993.
Then, as now, Australia’s woes were precipitated by events in the US. The Dow crashed 25% in a day in 1987 and so did the All Ordinaries. Australia had been enjoying a commodity boom, and both countries had run up huge levels of private debt. A credit crisis ensued in the US by 1990 when the value of “junk bonds” collapsed. Most of these were held by small US Savings & Loans associations (ostensibly small regional banks).
Is any of this sounding familiar?
Eventually 747 S&Ls would go under. But there is one big difference between the credit crisis of then and the credit crisis of now. In the eighties it was all about corporate debt. This time it’s all about household debt. The junk bonds of the eighties were packaged up to finance leveraged corporate buyouts. The junk bonds of the noughties were packaged up to finance leveraged low quality mortgages.
Mortgages were obviously hurt in the nineties as well – most of the “loans” issued by a Savings & Loan were mortgages. Today, highly-geared corporates are suffering from a blow-out in the cost of debt precipitated by the mortgage crisis. Ironically enough, the US government in the nineties responded to mortgage fallout by giving greater responsibilities to its two sponsored lenders – Fannie Mae and Freddie Mac.
If history thus repeats – and so far it just seems like an old script in a new production – we have had our 26% stock market fall of 1990 over 2007-08 (although we never had a preceding crash). We should now have a solid rally (on RBA interest rate cuts) before economic recession sets in (despite RBA interest rate cuts) during which we have eighteen months of sideways stock market drift.
But Dr Keen has suggested we are not heading into a 1991-92 recession, we are heading into the worst recession we have experienced since the Great Depression. Dr Keen has drawn not upon the experience of the US and Australia in the nineties, but of Japan.
The Japanese economic miracle began after the Second World War and ended abruptly in 1990 following a final late-eighties speculative bubble that burst spectacularly. Following the War, the Japanese government used strict policy measures to force its citizens to save. This led to massive surpluses, and very low interest rates. It also meant Japan’s export industry grew to dominate the world, with export prices kept low via low investment costs. Before we had “Made in China”, we had “Made in Japan”.
The yen appreciated accordingly – so much so that by the seventies the US government elected to abandon the gold standard of exchange rate setting (the US was broke following the Vietnam War). An ever-appreciating yen meant constantly growing value in Japanese assets. By the eighties this was represented by rampant speculation in the Japanese stock market, and in Japanese property. Then one day someone noted the value of the land under the Imperial Palace in Tokyo was worth more than all of California.
It was all over. This is what transpired:
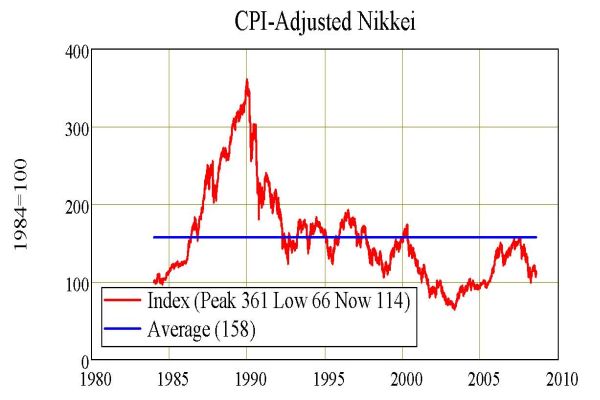
The Japanese Nikkei stock market index fell 82% from its high in 1990 to its low in 2003. This was Japan’s lost decade of asset deflation, which ultimately brought about a zero interest rate. To this day the Japanese rate is still only 0.5%. Dr Keen:
“At the time, most commentators blamed Japan’s Bubble Economy and subsequent financial crisis on the opaque and anti-competitive nature of its financial system. We were assured that nothing so ridiculous could happen in the transparent, competitive and well-regulated US financial system”.
The hint of sarcasm here stems from the fact that while the current financial crisis began with dodgy subprime mortgages, the real credit crunch occurred because the market for mortgage-backed securities was totally opaque, no one new how to price them, and there were insufficient regulations in place in the US to force anything out into the open, or to control the issuing of dodgy mortgages in the first place, or to prevent the catastrophe that then followed.
The US stock and property markets have now suffered major falls. To compare like with like, a CPI-adjusted graph of the US market looks like this:
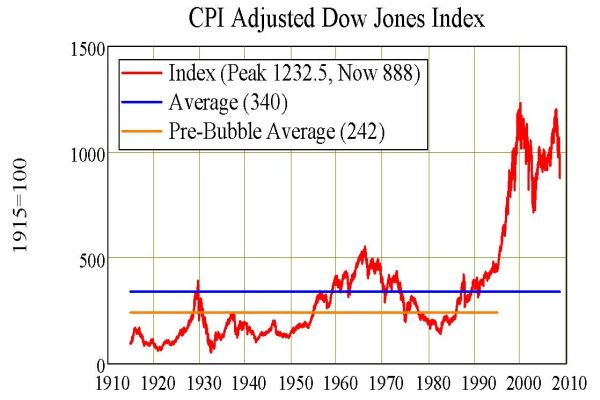
“While the Dow has fallen substantially in the last year,” notes Dr Keen, “its inflation-adjusted value is still three times its long-term average, and more than four times its average prior to the start of this bubble. Even if the index falls merely to its long term average, it still has another 62% to go (in real terms) from its current level. If it reverts to its pre-bubble average, it has another 73% to go”.
The fall in the US stock market has many coincident drivers, but they all come back to one source – the fall in the value of US houses. The average value of US houses has fallen substantially since 2006, and any argument held today about the fate of the US stock market from here on is inevitably drawn to opinions on whether houses prices will continue to fall. Many a commentator suggests we are nearing the end. Others have come to the conclusion we may be only about halfway through, or less.
If house prices continue to fall, banks and brokerages will need to continue writing down the value of their mortgage securities. To date about half a trillion US dollars-worth has been wiped off. Analysis by the likes of the International Monetary Fund suggest the final total will be in the order of one trillion. It is still unclear as to whether every holder of CDOs and other financial derivatives across the globe has to date written down values to realistic levels. If US house prices continue to fall, the ramifications remain stark.
The Case-Shiller house price index is now down 18% from its peak. Popular opinion puts the ultimate fall at 25-30%. Stock market analysts nevertheless argue that the stock market always “looks through” weak economic influences in order to get the jump on the eventual turnaround. In other words, the stock market should recover well before house prices hit bottom.
However, if US house prices revert to their pre-bubble average, as was the case in Japan, they will need to fall 55% in real terms, notes Dr Keen.
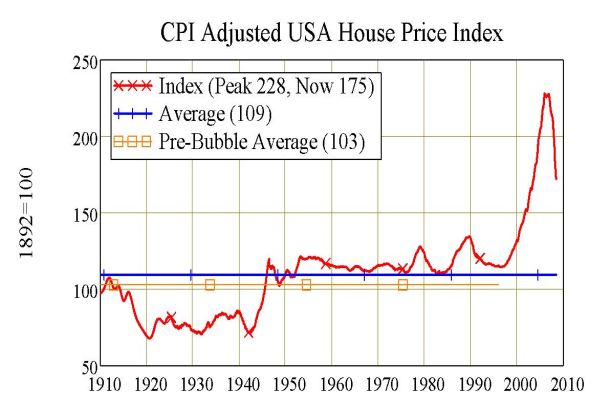
And a reversion to the mean in US stocks means a total fall of 80% in real terms. Says Dr Keen:
“The unique feature of this US asset bubble is that it affects both stocks and houses. Not only is it a bubble in both asset markets, both bubbles dwarf anything previously experienced. Even the great Roaring Twenties stock market bubble barely pokes its head above the long term average [see earlier graph], compared to the 2000s Stock Market bubble – and in the 1920s the housing market was relatively undervalued.”
The good news, however, is that the Australian stock market was not nearly as overvalued – in real terms – as the US market when we entered the credit crunch. Nevertheless, if the Australian market does follow history as provided by Japan, it too must fall further yet – by another 30% in real terms.
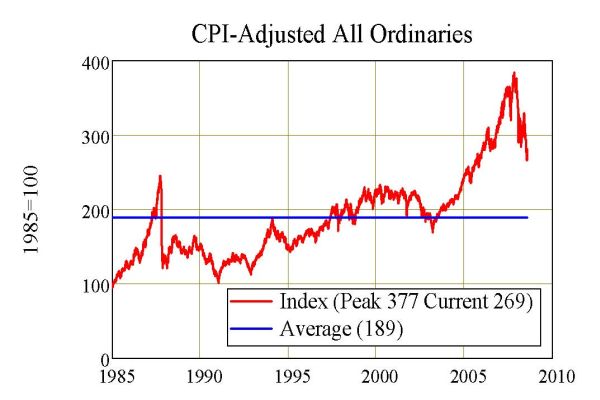
But more good news is provided by the fact that we know there could never be a house price collapse in Australia. Indeed, house prices should continue to rise for we are constantly told by economists that Australia is in a commodity boom, we have increased skilled immigration to record levels, and there is currently a shortage of some 200,000 homes in Australia. Haven’t you noticed rents? They have increased across the country. This will encourage investors into the property market once more. And Australia’s proportion of “subprime” mortgages issued is more like 1%, not 10-15% as is the case in the US.
Perhaps one day economists might wake up and realise they live in something called The Real World.
This week Australian economists switched their views on RBA monetary policy to a long period of “on hold” at 7.25%, as inflation remained a problem, to the possibility of a “double-cut” of 0.5% as early as September. The reason is that inflation fears have begun to ease and the Australian economy is suddenly showing signs it is slowing dramatically. This includes a sharp drop in retail sales and ever decreasing demand for credit – including housing finance. Why is no one borrowing to buy a house right now? Because they can’t afford it.
Australians are loaded to the gunnels with debt. Take a look back at the chart which opened this article. The massive debt-to-GDP corrections of the 1890s and 1930s stand out. Closer to today, there are only two minor blips – the deep recession of the oil-shocked 1970s, and the deep recession of the corporate debt-shocked 1990s. Australians can afford no more debt at current rates, recent data are telling us. Indeed, as the Australian economy slows down faster than economists were expecting, Australians are being forced to reduce debt. In some cases, this means selling a house because the mortgage payments can no longer be afforded. House prices in Australia have only just begun to turn.

Dr Keen sees the prognosis for the Australian housing market as “substantially worse” than that of the Australian stock market. Even taking only a 22-year average in real terms, Australian house prices need to fall 40% to revert to average.
Dr Keen can provide the last word:
“The level of overvaluation of asset markets reflects the unprecedented scale of private debt, both here and in America. The vast bulk of that debt was undertaken to finance speculation on shares and housing. This is the reason that this recession will be so severe – as will the asset market bust.
“Every ‘recovery’ from a debt-induced recession since 1970 has involved resumption in the tendency for debt to grow faster than GDP, yet today the debt to GDP ratio is more than twice that of the Great Depression. It simply cannot go any higher.
“Who else, after all, can banks lend to, now that they have exhausted the ‘subprime’ market?
“The only way for the debt to GDP ratio now is down and as it heads down, so will output and employment. A serious recession is inevitable.
“Welcome to “the recession we can’t avoid”.
***
Dr Steve Keen’s anlaysis can be accessed at www.debunkingeconomics.com. All charts are provided courtesy of Dr Keen.