Technicals | May 05 2011

By Greg Peel
This is a three-month chart of the S&P 500 index in the US:
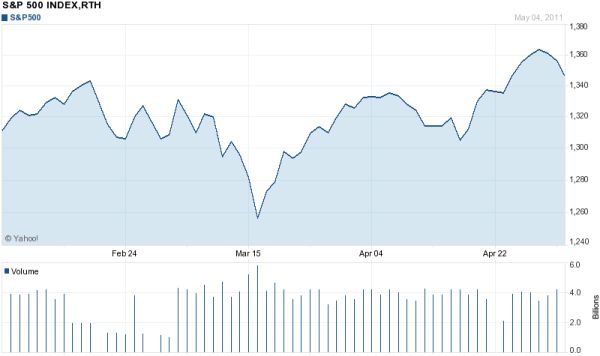
The index has seen a solid rise from its earthquake low in March, driven by better than expected results in the quarterly earnings season after a quelling of the initial disaster panic. Also driving stock prices have been commodity prices, particularly oil and precious metals, but in the last couple of days those prices have reversed with a vengeance.
We have thus now seen a pullback in the S&P and with the bulk of earnings reports now in from the large caps, and a long tail to come, traders have been taking the opportunity to take some profits.
But what the technical analysts are excited about is the confirmation of a “reverse head and shoulders” pattern in price movements, or perhaps more accurately an “upside down” head and shoulders. In the above graph, we see spiky activity in February with a consistent low around 1310 before the dip in March. That's a shoulder. The dip and recovery in March forms a head and then we see a peak-and-pullback in April with, again, a low around 1310. That's the other shoulder.
Try it this way:
A head and shoulders pattern is one of the most respected by technical analysts and the final bounce off 1310 towards new highs confirms this reverse formation. The expectation now is that the S&P 500 could pull back as far as 1310 again, but then it will be well set for a solid rally, perhaps even to 1500 by year-end.
Technical limitations
If you are reading this story through a third party distribution channel and you cannot see charts included, we apologise, but technical limitations are to blame.
Find out why FNArena subscribers like the service so much: "Your Feedback (Thank You)" – Warning this story contains unashamedly positive feedback on the service provided.