Technicals | Jun 06 2016

By Nick Linton-Ffrost
Pivot Levels
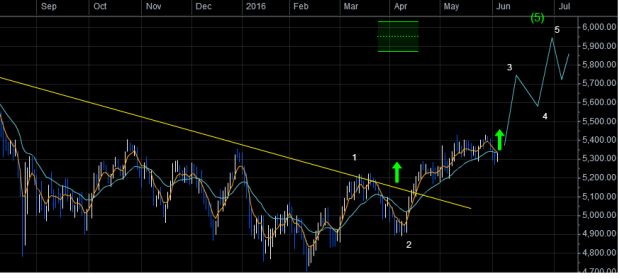
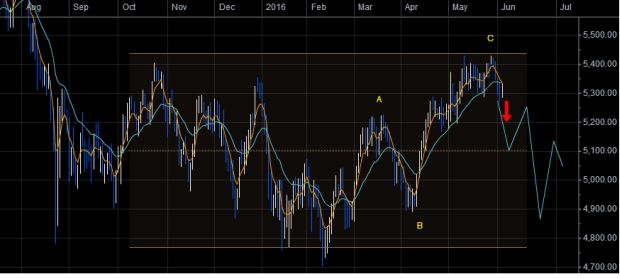
The bottom line for us is whether the rally in the ASX200 (XJO) from 4900 to 5425 has completed a ‘C’ wave or is part of a 3rd wave. We suspect the next few days trading will give us the answer. If the market is trading within a 3rd wave (top chart) the implication is for a rally to 5725 where ‘3’ approximates 1.618 times the length of wave’1′. From there we would expect a pull back to complete wave 4 before a move towards 5880-6000.
Our 5880 target is derived from the break above the one year downtrend line at 5200 and 6000 is 75% of the height of the nine month range added to the break point around 5425/50.
We think that trading above 5350 for more than 2 days should be enough to start the move higher. This view is contingent on the XJO holding above 5275/90 and pushing above 5350 within the next few days.
If the market has completed a ‘C’ wave (bottom chart) the implication is for 1-2 months trading between 4800 and 5300. We suspect if the market holds below 5350 and spends 2 days below 5275 that odds will turn in favour for a move south to 5100 (midpoint of the 9 mth pattern) followed by a bounce to 5250 before heading lower.
Another trading idea from
Fifth Wave | fwtc.com.au
FW generates over 150 Trading Alerts on the ASX100 each year. We are a subscription service specialising in short term technical strategies based on 27 years experience.
AFSL 319830 | Disclaimer
Reprinted with permission of the publisher. Content included in this article is not by association the view of FNArena (see our disclaimer).
Technical limitations
If you are reading this story through a third party distribution channel and you cannot see charts included, we apologise, but technical limitations are to blame.
Find out why FNArena subscribers like the service so much: "Your Feedback (Thank You)" – Warning this story contains unashamedly positive feedback on the service provided.