Technicals | 11:00 AM

Earlier today, Tony Sycamore, Market Analyst, IG updated his views and thoughts on financial markets, including the technical analysis.
All material has been re-published with permission and does not by association represent FNArena’s views (we have none, we simply report).
First Up, Nasdaq100
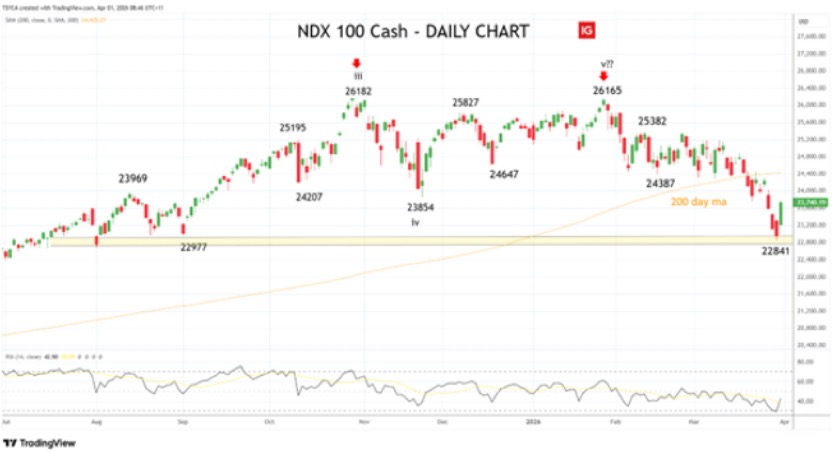
The Nasdaq100 commenced a correction after reaching its late-October peak at 26,182, a move that was later reinforced by a clear double top near 26,165 in late January.
The sell-off has intensified in recent weeks as the index first broke below its 200-day moving average, currently sitting at 24,410, and then broke below the November 21 low at 23,854.
That break served as a warning the correction could deepen, and it has with the index reaching the initial downside target of 23,000 on Monday.
While the bounce from support overnight eases downside risks, the index needs to reclaim the 200-day moving average at 24,425, and horizontal resistance zone at 24,500ish to negate the downside risks.
Until then, allow for further weakness towards the next major support sitting down at 22,200–22,000.
ASX200
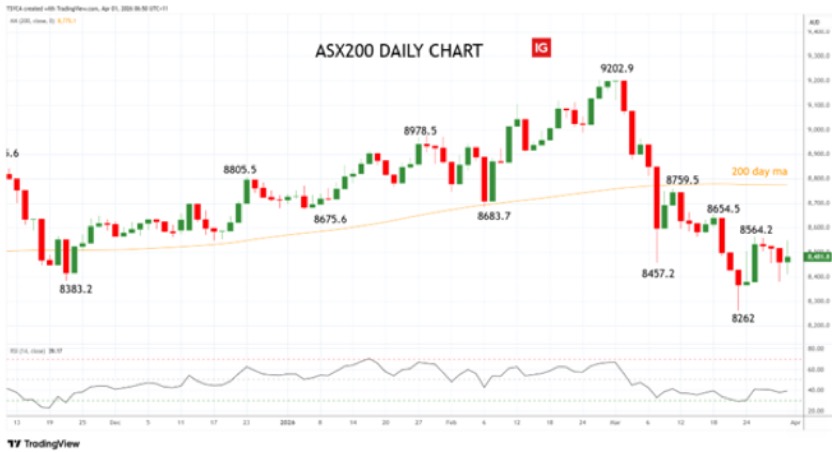
At last Monday’s 8262 low, the ASX200 has fallen -940 points or a neat -10.20% from the 9202.9 record high it struck in late February.
The rebound from the 8262 low into the close, left signs of capitulation in the daily candle.
While this was a positive development, the ASX200 must reclaim the 200-day moving average currently at 8775 on a sustained basis to increase confidence that a medium-term low is in place at the 8262 low, and that the uptrend has resumed.
Until then, a retest and break of the 8262 low is possible.
Crude Oil
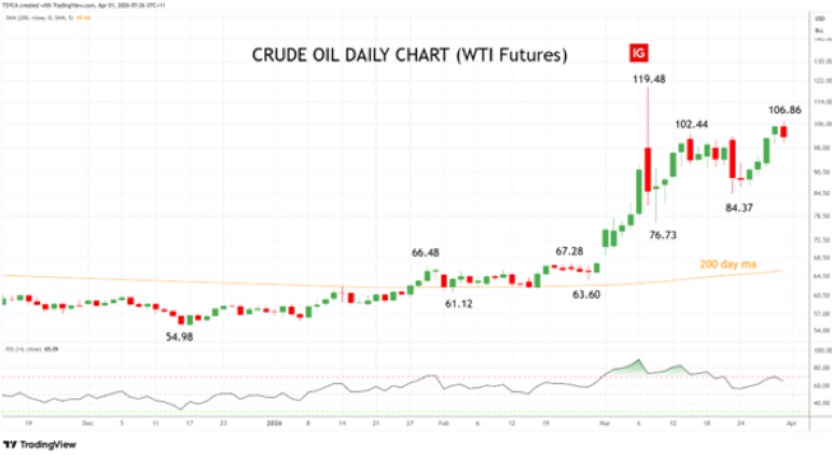
WTI Crude Oil is trading at US$101.56 (-3.29%) reversing lower from the US$106.86/bbl high it hit earlier in the session.
The reversal was triggered by de-escalation headlines that broke in the Asian session yesterday, as President Trump signalled he is willing to wind down the US military campaign against Iran.
That was followed by reports Iran is open to ending the conflict with certain guarantees, evidence that more commercial ships are using the Iran-controlled toll route through the Strait, and China and Pakistan are actively mediating ceasefire talks, including a joint five-point peace initiative calling for an immediate ceasefire and restored navigation in the Strait.
That said, the picture remains far from settled. Iran’s Revolutionary Guard has warned it will begin targeting US companies in the region starting today, while President Trump posted on Truth Social in a pointed message to NATO allies and Europe.
He told countries struggling with jet-fuel shortages, particularly the UK, which “refused to get involved in the decapitation of Iran” they should either buy from the US because “we have plenty” or “build up some delayed courage, go to the Strait, and just TAKE IT”.
As first outlined on March 10, and reiterated yesterday , we expect WTI to continue trading within a wide and choppy range between US$75 support and US$105/bbl.
Aware that should WTI crude oil see a sustained break above resistance at US$105/US$106.00ish, it would warn of a retest of resistance at US$120.00.
Gold
Gold is trading higher at US$4667/oz (up 3.49%), as growing hopes of de-escalation in the Iran conflict saw the backdrop for gold improve as the US dollar, US yields and energy prices fall.
After being bearish following its break below US$5000, we flipped to a bullish bias in gold early last week after it tested and bounced from our critical US$4200/US$4100 support zone.
From here, we are looking for a grind back towards US$5000 initially, and we’ll maintain this bullish bias providing gold holds firmly above support at US$4100/US$4090ish.
Technical limitations
If you are reading this story through a third party distribution channel and you cannot see charts included, we apologise, but technical limitations are to blame.
Find out why FNArena subscribers like the service so much: “Your Feedback (Thank You)” – Warning this story contains unashamedly positive feedback on the service provided.
FNArena is proud about its track record and past achievements: Ten Years On