Technicals | Jun 10 2026

Earlier today, Tony Sycamore, Market Analyst, IG updated his views and thoughts on financial markets, including the technical analysis updates.
First Up, Nasdaq100
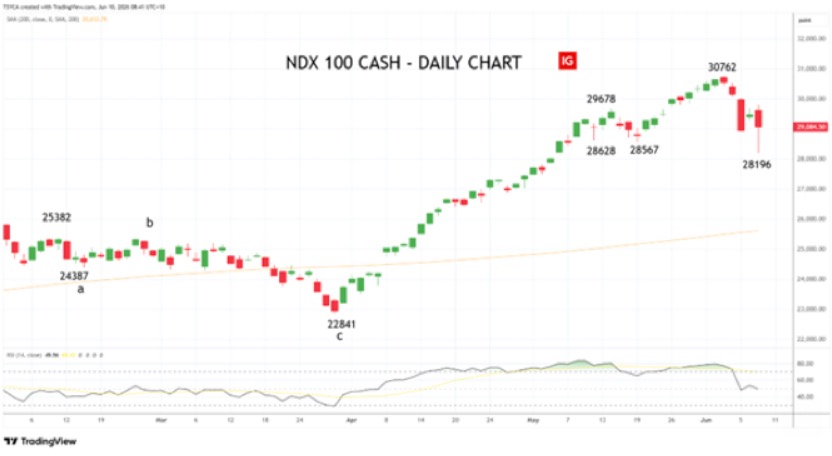
From its late-March low of 22,841, the Nasdaq100 staged an incredible rally, surging 35% in just over nine weeks to hit a high of 30,762 last Wednesday night.
In that context, the -8.30% pullback from the 30,762 record high into the overnight 28,196 low has not really been a surprise.
It was preceded by bearish RSI divergence which was partly behind our warning, that chasing the rally or giving in to FOMO was becoming increasingly risky.
From here, provided the Nasdaq100 can hold above a band of support 28,600/28,200ish (lows from Mid-May and overnight) we can’t rule out a retest and potential break of that 30,762-record high before a push towards 32,000.
However, should the 28,600/200 band of support give way (sustained basis), a deeper pullback into the 27,500/300 support region would likely come into play.
ASX200
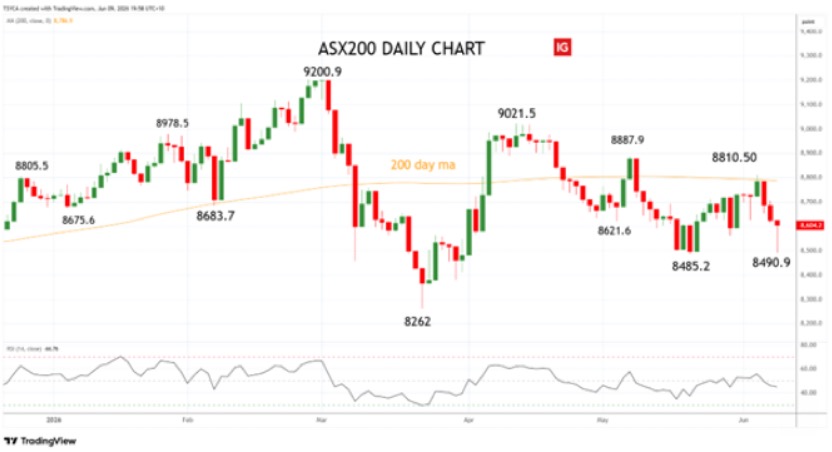
From its mid-April high of 9021.5, the ASX200 shed 536 points (-5.9%) into the May 8485.2 low.
The subsequent rebound from the 8484.2 low saw the ASX200 briefly push above the 200-day moving average in early June to a high of 8810.5, before reversing lower to revisit the 8485-support area yesterday.
While the bounce from the 8490/80 support area was a positive short-term development, the ASX200 remains in a range between in 8800 and 8500ish.
A break above the 200-day moving average now at 8786.9 and last week’s 8810.5 high would alleviate downside risks and open the way for the ASX200 to push towards the mid-April 9021.5 high.
Conversely, a sustained break of support at 8490/80 would open the way for a retest of the March 8262 low.
Crude Oil
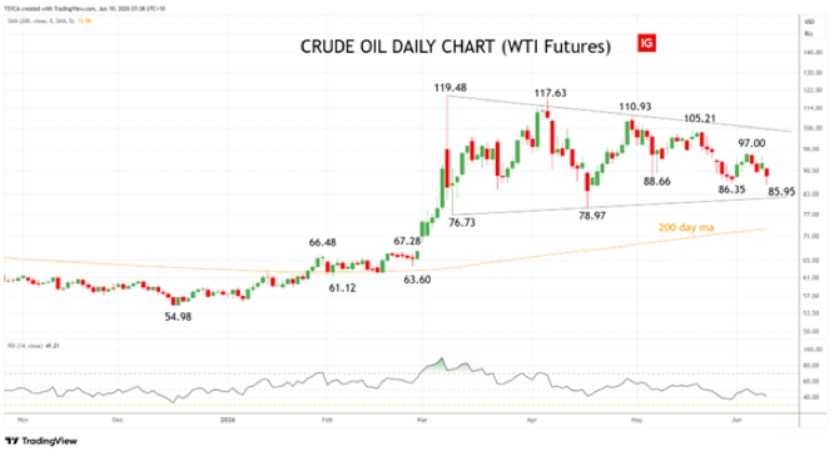
WTI Crude Oil finished lower overnight at US$88.70 (-2.83%), after hitting a seven-week low of US$85.95 earlier in the session.
The pullback extended, following President Trump’s direct appeal for both sides (Iran and Israel) to stop shooting while adding that negotiations with Tehran were entering the final stages, with a clearer outcome possible within days.
That de-escalation helped push prices lower, but the session wasn’t without drama.
Late in the US session, Trump confirmed Iran had shot down a US Army Apache helicopter in the Strait of Hormuz, prompting US Central Command to launch limited self-defence strikes against Iranian sites.
While the response was described as measured, it served as a reminder the path to a lasting ceasefire remains challenging, and the risk of misstep remains high.
On the demand side, China’s crude imports slumped to around 7.8 million barrels per day in May — the lowest level in more than eight years and nearly -4 million barrels per day below the 2025 average.
The sharp drop in demand from the world’s largest importer, combined with record US exports and ongoing SPR releases, has managed to keep a lid on prices for now.
Looking ahead, the near-term focus remains on whether the ceasefire sticks as boundaries are tested, and how quickly US-Iran talks progress.
Vice President JD Vance told CBS that a deal could come in weeks or months but will definitely come before the midterms – hmmmm.
From a technical perspective, crude oil continues to coil/correct and as long as the price can hold above support in the low US$80s, the risks remain firmly skewed to the upside.
Gold
Gold finished lower overnight at US$4259 (-1.62%), its lowest daily close in six months.
The decline in bullion tracked weakness in US equity markets — a correlation we’ve noted in recent months after retail investors become heavily involved in the metals space in the precious metals bull market run higher.
Nerves ahead of tonight’s key US inflation data likely added to the selling pressure.
Technically, provided gold remains below the 200-day moving average at US$4440 —which it broke below on Friday night— it remains vulnerable to a retest of the March low at US$4098, with scope for a deeper move back toward the late October 2025 low near US$3886.
All material has been re-published with permission and does not by association represent FNArena’s views.
Technical limitations
If you are reading this story through a third party distribution channel and you cannot see the charts included, we apologise, but technical limitations are to blame.
Find out why FNArena subscribers like the service so much: “Your Feedback (Thank You)” – Warning this story contains unashamedly positive feedback on the service provided.
FNArena is proud about its track record and past achievements: Ten Years On