Technicals | Jun 24 2026

Earlier today, Tony Sycamore, Market Analyst, IG updated his views and thoughts on financial markets, including the technical analysis updates.
Nasdaq100
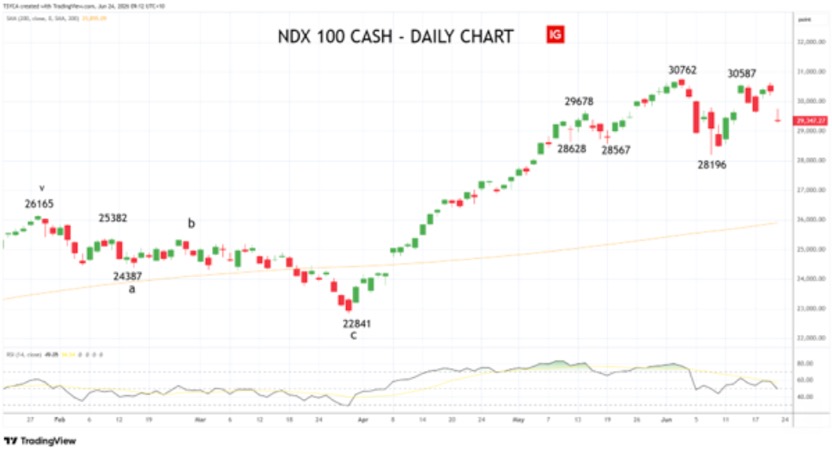
From its late-March low of 22,841, the Nasdaq100 launched a jaw dropping 35% rally in just over nine weeks to reach a record high of 30,762 in early June.
The rally was in line with our bullish calls, although it did hit the 30,000 target some six months earlier than we were expecting. In that context, the -8.3% pullback to the recent 28,196 low was hardly surprising.
Looking ahead, as long as the Nasdaq100 holds above support at 28,000ish the view is any pullback is part of a correction and the door remains open for a retest and break of the 30,762-record high, before the next upside target at around 32,000.
However, a sustained break below the 28,000ish support area would open the door to a deeper correction into the 27,200–27,000 region.
ASX200
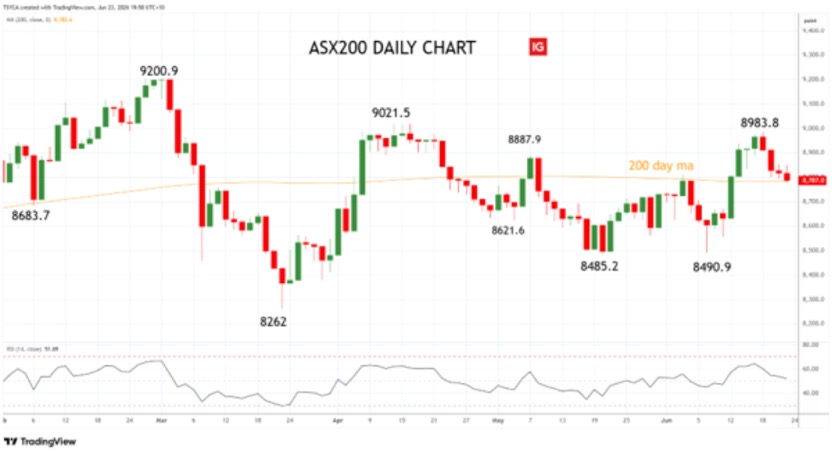
Early last week, the index hit a nine-week high of 8983.8. Provided any pullback from the 8983.8 high holds above a band of support at 8800–8780ish (which includes the 200-day ma at 8782), it keeps open a test and break of the mid-April 9021.5 high.
Aware that if the ASX200 were to fall below support at 8800–8780 (sustained basis), it would be an initial indication the recent break higher has failed and raise the risk of a deeper pullback towards the lower end of the recent range.
Crude Oil
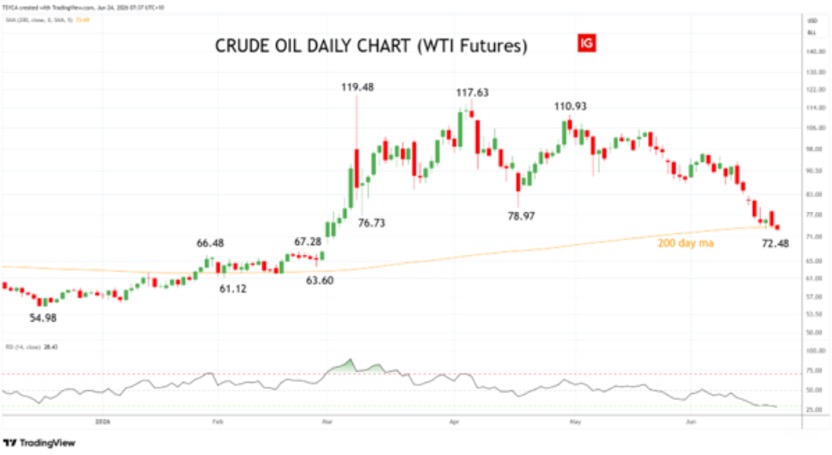
WTI Crude Oil finished lower overnight at US$73.05 (-1.39%), its lowest level since early March as the market continues to reprice the prospect of returning barrels and more normal flows through the Strait of Hormuz.
A fresh IEA report underscores the remarkable agility of global supply chains in filling the massive vacuum left when flows through the Strait collapsed from roughly 20 million barrels per day (bpd) pre-conflict to an average of just 2.7 million bpd between March and May.
1. An IEA-coordinated emergency stock release of 400 million barrels, coupled with agile Gulf Coast producers rerouting volumes via pipelines, injected significant liquidity into the system.
2. Atlantic Basin producers, led by the United States, aggressively ramped up exports to Asia, while refiners globally pivoted their yields to offset the loss of Middle Eastern crude and refined products—most notably jet fuel.
3. The global market entered the crisis with substantial buffers. In February, prior to the outbreak of hostilities, IEA market balances already projected a surplus of 3.7 million bpd for 2026 as a whole.
4. Having strategically built massive inventories before the conflict, China was able to slash its crude imports by -40%, or -4.6 million bpd, during the peak disruption period between February and May.
With a 60-day US sanctions waiver now active and working groups established following high-level talks in Switzerland, tanker traffic is beginning to normalize through the Strait.
From a technical perspective, WTI crude is once again testing (breaking?) the critical support zone defined by the US$74.89 level (the 200-week moving average) and US$73.64 (the 200-day moving average).
Crude must defend this support band on a sustained basis to avoid a deeper, more damaging slide below the US$70.00 handle.
Gold
Gold finished lower overnight at US$4110 (-1.93%).
The yellow metal was weighed down by a resurgent US dollar, climbing yields and a selloff in equities in the wake of last week’s hawkish FOMC meeting.
With the rates market now pricing in a 40% chance of a Fed rate hike as early as next month, the non-yielding asset is finding it difficult to maintain its footing against the backdrop of a more aggressive central bank stance.
The rebound from the recent US$4023 low has raised the prospect that a short-term —and possibly medium-term— low is in place for gold.
However, to increase confidence in this view, gold needs to reclaim downtrend resistance at US$4360ish and then the 200-day moving average at US$4468.
Until then, a break of support at US$4000 before a test of October 2025 low at US$3886 appears likely.
All material has been re-published with permission and does not by association represent FNArena’s views.
Technical limitations
If you are reading this story through a third party distribution channel and you cannot see charts included, we apologise, but technical limitations are to blame.
Find out why FNArena subscribers like the service so much: “Your Feedback (Thank You)” – Warning this story contains unashamedly positive feedback on the service provided.
FNArena is proud about its track record and past achievements: Ten Years On