
Australia | Sep 23 2010

This story features ASX LIMITED.
For more info SHARE ANALYSIS: ASX
The company is included in ASX50, ASX100, ASX200, ASX300 and ALL-ORDS
By Greg Peel
If ever there were a success story with regard to a new financial product listed on an exchange in recent times, it is the VIX volatility index. It might have taken a GFC for this index to really come to the forefront of analyst, commentator and investor focus, but it is a rare day that goes by now in the US without someone making note of the VIX in their reporting.
The VIX was invented by the Chicago Board Options Exchange as a forward-looking indicator of investor sentiment with respect to the broad US stock market, in the form of the S&P 500 index. Now, in conjunction with the CBOE, the Australian Stock Exchange ((ASX)) has brought the VIX to Australia to be measured with respect to the ASX 200.
So what's a VIX when it's at home?
As we all know, stock markets can bungle through periods of relative quiet and then be beset by periods of horrific volatility, manifested by sharp intraday moves in share prices which equate to similarly sharp movements in stock price indices. Volatility is measured statistically on the basis of standard deviations away from the mean, but in simple terms a volatility measure ascribes a value to just how violently or otherwise index values are flying around at any given time.
At the end of a day, or some other period, by punching in price movements into a model we can ascribe a value to the volatility of the session. But this is “historical” volatility. It might prove helpful in guessing what volatility might be like in the next session, but it's not actually a forecast tool.
Which brings us to options. Options provide the opportunity to place a bet on the movement of the market without having to actually buy or sell the market. Because of the “chance” involved in such a bet, options are priced on a “premium” basis which allows investors to make such a bet with only a small amount of money down. The greater the odds, the cheaper the cost of the option.
The best way to understand options is to think of the fire insurance you have on your house. For a comparatively small amount of money each year, an insurance company will guarantee to pay you the full value of your house should it burn down by accident. The reason insurance companies would be seemingly foolish enough to exchange a large amount of money for only a small amount of money is because not that many houses burn down each year compared to the total number of all houses. The premium charged by the company for fire insurance is carefully calculated by the company based on the odds of any particular house burning down and the statistical history of such occurrences. Every year the company collects money from all its homeowners, safe in the knowledge that this will total to more than the cost of replacing the handful of houses statistics suggest will burn down.
When you buy an option on, say, a stock, it will provide you with the right to buy (call option) or sell (put option) that stock on or before a given date at a given stock price. The odds of you ultimately exercising that right are greater the nearer the exercise price is to the current price and also greater the more period of time there is for the stock to move to that price. And vice versa for more “out of the money” or for a shorter time period.
The premium paid for an option will be determined by these two factors, and in simple terms the premium represents the “odds” of you exercising that option. But there is another element.
If you hold an out-of-the-money call option to a certain time and recently the market has been really quiet, there's less chance of the stock price reaching your exercise price than if the market has recently been really volatile. So in more volatile times, you have to pay more for your option.
Options traded on an exchange are just like shares traded on an exchange – the closing price at the end of the day represents the net of buying and selling and as such is a reflection of demand and supply. The higher the closing price of an option, all things being equal, the greater the implicit demand for that option. The more an option buyer believes a market is going to be volatile ahead, the more premium he will be prepared to pay. Given we know what the exercise price and date of the option are, we can plug the closing price into our equation and out pops a measure of implicit demand, or if you like “implied volatility”.
Implied volatility tells us what the buyer thinks might happen next, or is afraid of happening next, rather than what has already transpired.
While you can't “buy” the S&P 500 (you can buy every stock in the correct weightings to replicate the S&P 500 but those weighting change by the second), you can buy an option on the S&P 500 which is settled by handing over cash rather than stock. Stock index options are extremely popular across the globe, as they offer the chance for an investor to place a leveraged bet, or to protect against a position already held. In the latter case, a common trade is to buy an out-of-the-money put option for a “fire insurance” premium as protection for a long stock portfolio. The more volatile the market, the more chance it has of tanking, and thus the more you'd be prepared to pay for insurance.
And this is where a volatility index comes in. The VIX on the S&P 500 measures the demand for options (call and put) over the S&P 500 index, and in so doing measures the “implied volatility” of the market, by plugging closing prices of all the near-month options series into the equation and spitting out a number.
It is important to note that an implied volatility measure is no more “correct” than your tip for this year's Cup. It is simply an applied tangible measure of the intangible concept of “sentiment”. For example, let's say we're worried that Greece might be about to default on its debt and we know that were that to occur, the stock market would tank. So we buy a put option as protection, thus pushing up implied volatility, only to find that Greece does not default before the option expires. We're actually quite relieved Greece didn't default, despite losing our premium, just as one is rather relieved when one's house does not in fact burn down.
But we were scared, and that “sentiment” was manifested in the volatility we feared as “implied” by the price we were prepared to pay for the put option.
So the VIX will move up and down depending on the implication of market sentiment. Now- because a VIX measures both put and call option premiums, one might assume that it is directionally ambivalent. There can be a high demand for calls when the market is bullish, so a high VIX measure would result. There can be a high demand for put options when the market is bearish, so a high VIX measure would result. A low VIX number would only result if no one was quite sure which way we were going.
But that's not the case, because that's not the way sentiment, or more correctly human nature, works. We all know that stock markets go “up by the stairs and down by the elevator”. Markets never panic to the upside. They may run very far very fast on exuberance, but they just don't “crash” up. They do, however, crash down – often, and in a big way. Therefore, a VIX can be more realistically interpreted as a measure of market fear. Typically if the market is really worried, it will pay up for puts, so a high VIX level indicates that fear. If a market is looking strong, however, investors will not feel the need to pay up for puts, and thus a low VIX will reflect confidence in the market.
Note the following 5-year chart of the VIX on the S&P 500:
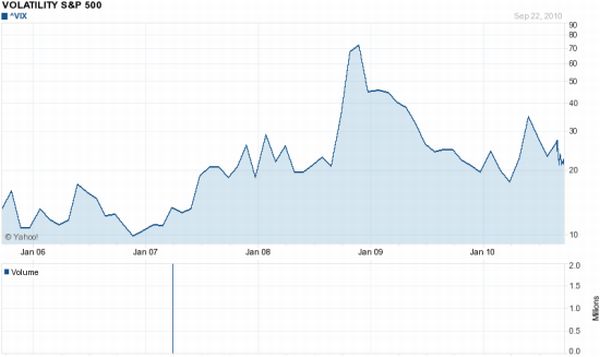
Note that in 2006 and through to mid-2007 the VIX was comfortable at low levels in the teens. The stock market was booming and everyone was confident. Then in late 2007, everything went pear-shaped before the VIX shot up to 30 in early 2008. In its history, the VIX had rarely been above 30 and never above 40. But Bear Stearns was being bailed out and everyone was nervous. I don't need to tell you where on the chart Lehman went under.
This is a closing price graph, and in fact the VIX reached an intra-day high of 90 when Lehman went down. As the dust settled, so did the VIX settle back, before another spike when Greece hit the radar. Last night the VIX closed at 22, which is at the low end of the range and reflects the fact we've had a good September rally.
This is all well and good, but isn't the VIX only telling us what “has happened” rather than what “will happen”. Well yes – unless you play the VIX from a contrarian point of view.
If the VIX gets too low, particularly below 20, the contrarians get worried. They know that stock markets never stand still for too long or go up for too long without a correction, and the most likely time for a correction to occur is when investors have become too complacent. A fall below 20 in the VIX is seen as entering complacency territory.
On the flipside, if the VIX is over 30 or more then it could be the market is overly panicked. It would surely be if we had not seen levels of 70-90 in 2008, but then 2008 was a tad unusual. So if the VIX is over 30 and on its way to 40, the contrarians start talking “oversold” and begin looking for a time to buy.
So as a reverse-psychology meter, the VIX has proven increasingly popular. Of course, if everyone was trying to play reverse psychology, the VIX would end up standing still. But at the end of the day, an investor will always say “Get me out!” if a stock market is tumbling, and put option demand will always spike in times of fear and fall in times of complacency. For that, the VIX has become a valuable tool.
As of today, the ASX will publish an end-of-day measure of the VIX volatility index on the ASX 200, using the CBOE's model. In the future, the ASX will move to intraday continuous pricing, and ultimately will look at matching the CBOE by actually offering options on the VIX.
Options on the VIX are really options on options, or “second derivatives”. Let's not go there right now.
Click to view our Glossary of Financial Terms
CHARTS
For more info SHARE ANALYSIS: ASX - ASX LIMITED
