Technicals | Apr 29 2026

Earlier today, Tony Sycamore, Market Analyst, IG updated his views and thoughts on financial markets, including technical analysis.
All material has been re-published with permission and does not by association represent FNArena’s views (we have none, we simply report).
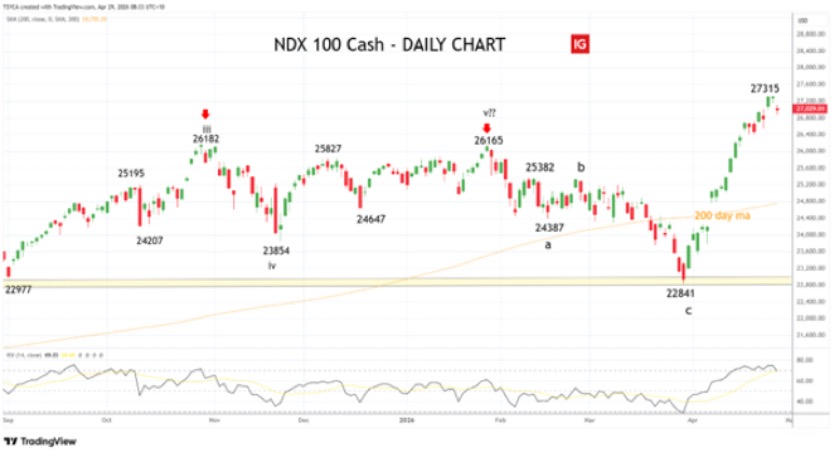
First Up, Nasdaq100
The Nasdaq100 began a correction after hitting its late-October record high of 26,182, before bottoming at the late March low of 22,841.
At no point was the correction to the 22,841 low viewed as anything other than a healthy technical correction following a strong rally from the Liberation Day lows.
After the rally from the March lows extended into overbought territory, we are now seeing some consolidation with the former double top at 26,200/100 likely to offer solid support if tested.
For those with a longer-term horizon who are comfortable with periods of consolidation, there is no reason the current rally cannot mirror the powerful move seen after the Liberation Day lows and head to 27,500 before 30,000 by year-end.
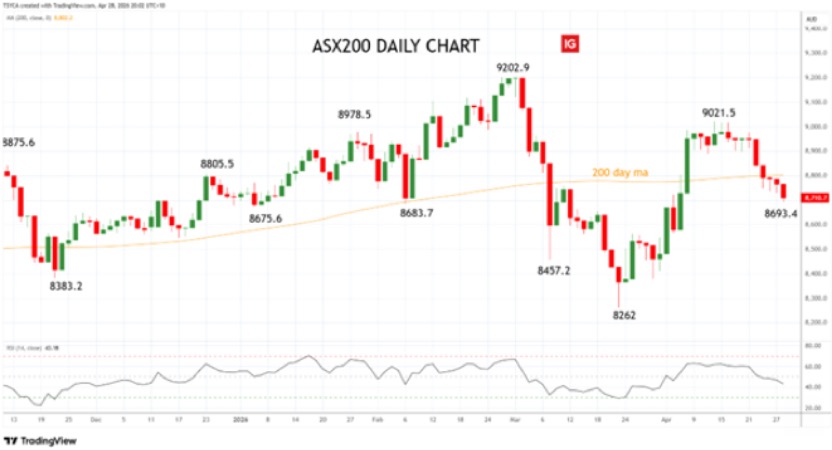
ASX200
From the 8262 low it hit on 23 March, the ASX200 rallied 759 points or 9.20% to a high of 9021.5 in Mid-April.
The advance then stalled, with the index falling back below the support provided by the pivotal 200 day moving average currently at 8802.
Looking ahead, the ASX200 must reclaim the 200-day moving average at 8802 (closing basis) to restore the constructive outlook and to position for a retest of the 9200-record high.
Failure to do so would warn of a deeper correction, with initial support located at 8,600/8,580.
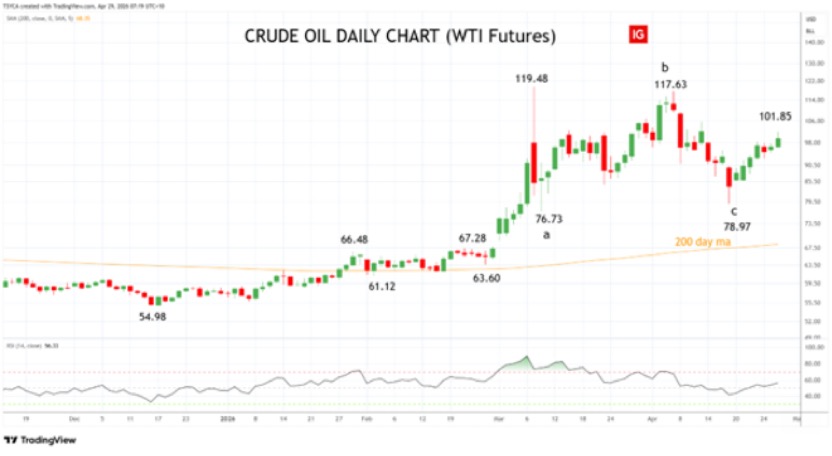
Crude Oil
WTI Crude Oil finished higher overnight at US$99.62, up 3.04%, its highest daily close in over two weeks.
The overnight gains came as persistent supply worries from the largely closed Strait of Hormuz outweighed reports the UAE was leaving OPEC and the wider OPEC-Plus alliance.
The UAE’s decision to exit the cartel will allow it to benefit from its heavy investments in energy infrastructure in recent years.
Freed from OPEC-Plus’ quotas, the country could ramp up to its true production capacity of around 5 million barrels per day, rather than the roughly 3 million bpd it has been capped at.
This development, however, is unlikely to have any significant short-term impact.
The Habshan-Fujairah pipeline, its only bypass around the Strait of Hormuz has capacity for 1.5 million barrels per day which it is currently moving, expandable only to 1.8 million under extreme scenarios.
Meanwhile, further highlighting the difficulty in securing a comprehensive peace deal that includes Iran’s nuclear program, President Trump noted Iran had described itself as in a “state of collapse”.
Adding a fresh layer of intrigue, a Japanese-linked supertanker —the Idemitsu Maru— successfully transited the Strait overnight, carrying around 2 million barrels of Saudi crude.
The passage, confirmed by both Iranian state media and ship-tracking data, occurred with explicit Iranian coordination.
Finally, the pressure on Iran’s aging onshore oil fields continues to build. The latest updates suggest storage facilities are expected to hit maximum capacity in the next two to three weeks, rather than this week as previously thought, with Iran now utilising 30-year-old VLCC’s as temporary storage.
If forced well shut-ins become necessary, Tehran risks irreversible long-term damage to its reservoirs and a serious blow to future production and revenue.
While all these crosscurrents are playing out, the technicals have truly become our north star. As we noted at the beginning of last week, the crude oil chart has turned increasingly bullish.
The pullback from the March 9th US$119.48 high appears corrective and provided WTI holds above the key US$76–US$79 support zone, there is potential for a retest and break of that March US$119.48 high.
Gold
Gold finished lower overnight at US$4596, down -1.82%, extending its pullback from last week’s high of US$4891. This move came as higher energy prices and rising US Treasury yields weighed heavily on the precious metal.
Simultaneously, equities extended their recent pullback.
As we have consistently highlighted, gold is currently trading more like a risk asset (similar to equities) rather than a traditional safe haven, largely due to the strong retail participation drawn into the precious metals space over the past eighteen months.
While we continue to maintain a bullish long-term view on gold, the short-term picture has become more clouded in terms of how deep the current pullback might extend.
Technical limitations
If you are reading this story through a third party distribution channel and you cannot see charts included, we apologise, but technical limitations are to blame.
Find out why FNArena subscribers like the service so much: “Your Feedback (Thank You)” – Warning this story contains unashamedly positive feedback on the service provided.
FNArena is proud about its track record and past achievements: Ten Years On