Technicals | Jun 17 2026

Earlier today, Tony Sycamore, Market Analyst, IG updated his views and thoughts on financial markets, including the technical analysis updates.
First Up, Nasdaq100
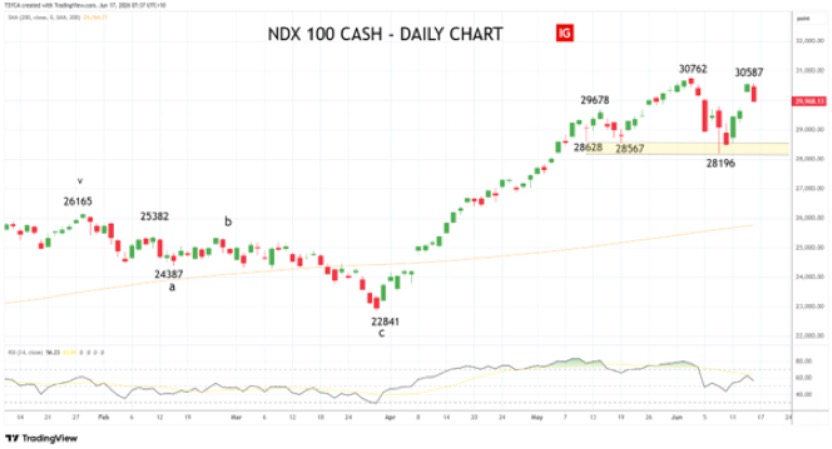
From its late-March low of 22,841, the Nasdaq100 launched a jaw dropping 35% rally in just over nine weeks to reach a record high of 30,762 in early June.
The rally was in line with our bullish calls, but hit the 30,000 target some seven months earlier than we were expecting.
In that context, the -8.3% pullback to last week’s low of 28,196 was hardly surprising. The move was preceded by clear bearish RSI divergence, which prompted our calls in late May that chasing the rally and giving in to FOMO was becoming increasingly risky.
Looking ahead, as long as the Nasdaq100 holds above support at 28,000-ish the door remains open for a retest and break of the 30,762-record high, before the next upside target at around 32,000.
However, a sustained break below the 28,000-ish would open the door to a deeper correction toward the 27,200–27,000 region.
ASX200
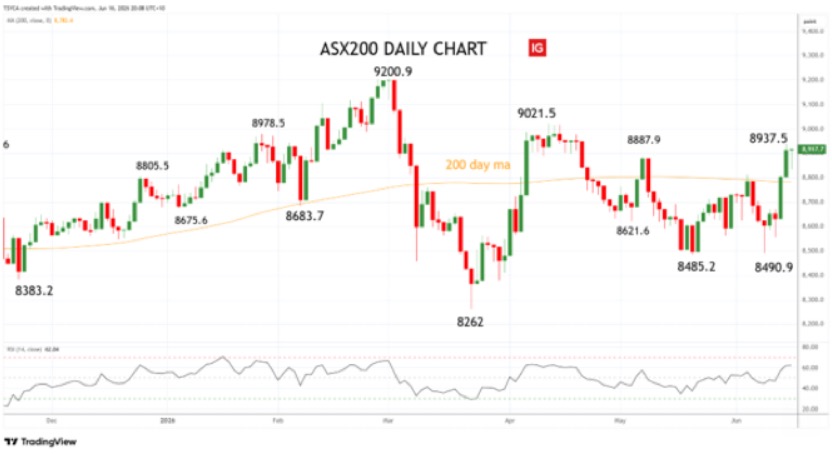
Following its retreat from the mid-April high of 9021.5, the ASX200 then spent two months trading in a volatile range between 8810-ish and 8490-ish.
Earlier this week, the index surged through the top of that range. Provided the break holds above support at 8800–8780 over the coming sessions, it clears the way for further gains toward the mid-April record high at 9021.5.
Aware that if the ASX200 retreats back through initial support at 8800–8780, it would signal the break higher has failed and raise the risk of a deeper pullback towards the lower end of the recent range.
Crude Oil
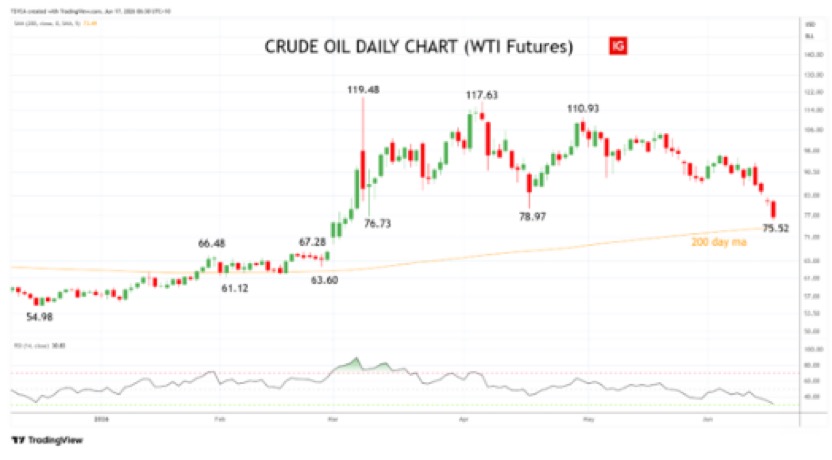
WTI Crude Oil finished lower overnight at US$76.66 (down -5.59%), extending its weekly loss to a thumping -9%.
The sell-off gathered serious momentum following the unexpected news that the impending US-Iran agreement will allow Tehran to resume its oil sales immediately.
Adding to the downward pressure, and severely undercutting yesterday’s narrative that it could take weeks or even months for the Strait of Hormuz to properly reopen, fresh reports have emerged in recent hours that Iranian tankers have already been spotted departing after the two-month blockade.
The first crude exports in weeks are now actively heading to market. At the same time, dozens of Very Large Crude Carriers (VLCCs) are currently steaming towards the Strait in anticipation of Friday’s expected formal signing of the agreement.
On top of this, fascinating details have emerged explaining how the US military has been quietly supporting Gulf exports throughout the crisis.
Via coordinated ship-to-ship transfers off they have managed to move tens of millions of barrels through the Strait since early May.
This covert operation, which no doubt has the potential to become a blockbuster action move involved staggered transits, “dark” ships operating without AIS transponders, and heavy aerial monitoring to keep crude flowing despite the Iranian restrictions on the Strait.
This dramatic decline has brought crude oil down to test an extremely important band of support sitting between US$75.00 (the 200-week moving average) and US$73.50 (the 200-day moving average).
This zone absolutely needs to hold to prevent a steeper slide back below the US$70.00 handle.
Gold
Gold finished higher overnight at US$4331 (up 0.52%), continuing to find support from improved risk sentiment and softer oil prices, both of which have weighed on the US dollar and Treasury yields.
The next challenge for gold comes from tomorrow morning’s FOMC meeting. There is a view that new Fed Chair Warsh, while expected to say less than his predecessor, might at the same time find a way to sound more hawkish.
Technically, after a sharp -28% pullback from the all-time high of US$5602, gold staged an emphatic rebound last week from just above the key US$4000 support level.
This raises the possibility the metal has put in a short-term —and potentially a medium-term— low.
The case for a medium term low and a move to US$5000 would increase in conviction if gold can reclaim the 200-day moving average at US$4450 in the coming sessions.
All material has been re-published with permission and does not by association represent FNArena’s views.
Technical limitations
If you are reading this story through a third party distribution channel and you cannot see charts included, we apologise, but technical limitations are to blame.
Find out why FNArena subscribers like the service so much: “Your Feedback (Thank You)” – Warning this story contains unashamedly positive feedback on the service provided.
FNArena is proud about its track record and past achievements: Ten Years On